The Apple v. Samsung case is a peep show of sorts, a pornographic public showing of the two technology giant’s closely kept secrets to the extent that we have for the first time been allowed to examine a bunch of early device prototypes, read internal communication about Apple’s engineering process, including tidbits like Apple’s ‘kitchen’ brainstorming, and laugh over such mundane things as stickers on court exhibits.
And now, a very important and confidential piece of information has also been publicized, Apple’s and Samsung’s sales numbers…
Though both companies fought hard to keep this confidential data from the public, the numbers are out for everyone to see and the jury will rely on them to eventually determine damages.
Ina Fried with the AllThingsD blog gets the credit for uncovering court documents pertaining to Apple’s and Samsung’s sales numbers in the United States [PDF document].
Since the original iPhone’s introduction in 2007 and through the second quarter of 2012, Apple sold 85 million iPhones in the United States for a total of $50 billion in revenue.
In the same period of time, Cupertino moved 46 million iPod touch devices worth approximately $10.3 billion in total revenue. As for iPads, Apple sold 34 million units in the U.S. for a cool $19 billion in revenue.
Another way to look at those numbers, per Fortune’s Philip Elmer-DeWitt: Apple sold 5.7 million tablets in the U.S. last quarter and Samsung sold 37,000. The official data led Financial Alchemist‘s Turley Muller to point out (rightfully) that we should all read IDC’s estimates with much greater scrutiny.
No doubt analysts who closely watch Apple’s performance like Asymco‘s Horade Dediu will be eager to bake in those official figures into their future estimates.
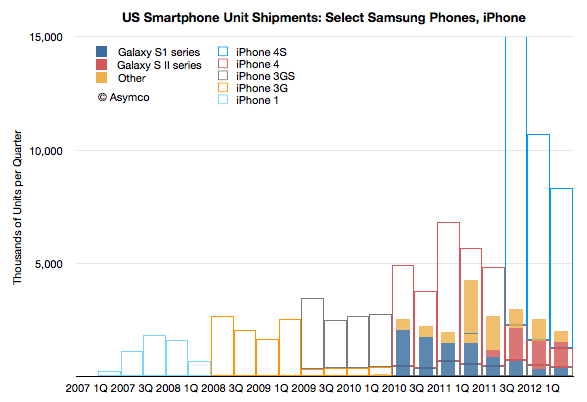
For example, this is Dediu’s estimate of Apple’s and Samsung’s respective smartphone sales in the U.S., posted yesterday.
Chart courtesy of Asymco
All told, court data shows Apple raked in nearly $80 billion in iOS device revenues alone in the past five years. In case you were wondering, the revenue Apple now makes on the iPhone alone is greater than Microsoft’s entire revenue.
The numbers for Samsung cover only the time frame relevant to the case, meaning from June 2010 through June 2012. During this period, the South Korean company moved 21.25 million smartphone units which raked in $7.5 billion in revenue. Its Galaxy tablets sold 1.4 million units worth $644 million in revenue.
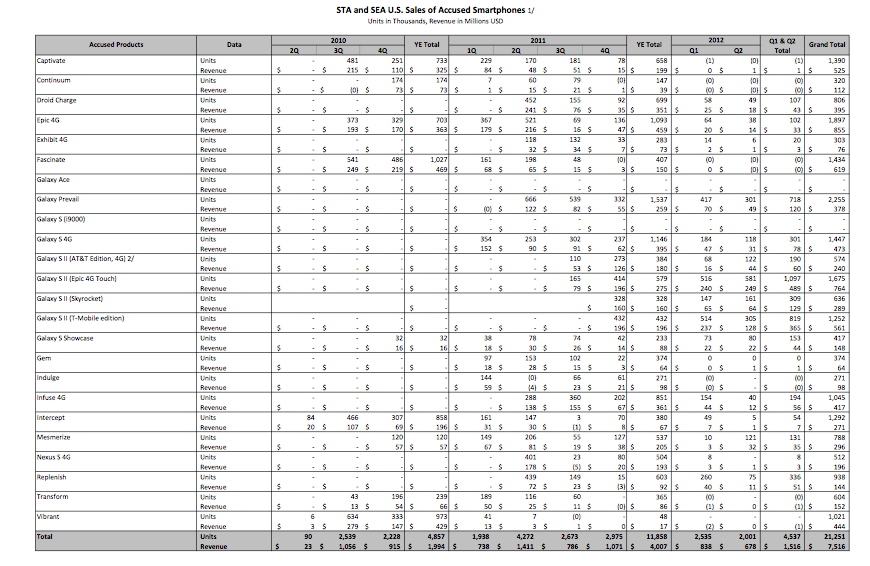
Here’s the full breakdown of Apple’s and Samsung’s U.S. performance.
Click to enlarge
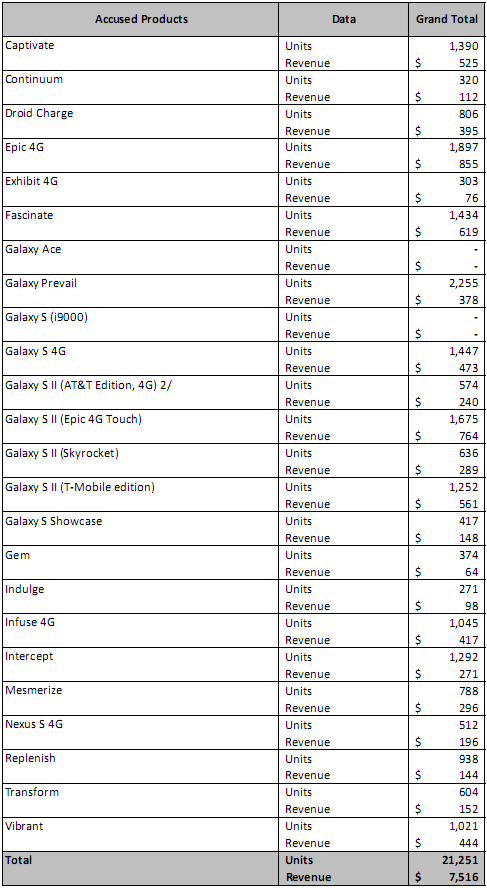
As evident from the above table, the 24 Samsung phones Apple alleges infringe upon its patents and design sold more than 21 million units in the U.S.
Here are just those 24 devices.
Table courtesy of The Verge
As for the Galaxy S II, Samsung moved a total of 4.1 million units, with the Galaxy S II Epic 4G Touch selling 1.68 million units for a nice $764 million in revenue. Samsung got the most revenue out of its Epic 4G device, which generated $855 million in U.S. revenue, while the Galaxy Prevail files as the company’s U.S. best-seller, with 2.25 million units sold
The original Galaxy Tab 10.1 moved just 585,000 units and its LTE counterpart just 125,000.
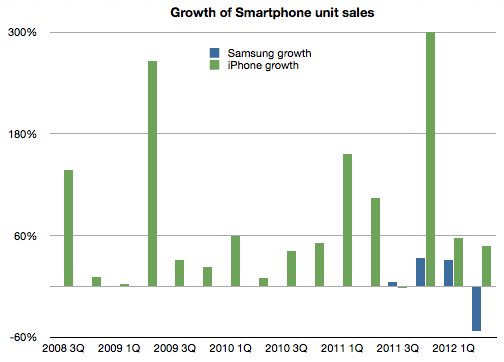
Taking those numbers, Asymco’s Dediu created the chart below to highlight how Apple’s been growing in the U.S. at a much more rapid pace than its frenemy Samsung.
Dediu explains:
What is surprising is that the overall sales volume is not growing. At least for the products catalogued (which exclude the Note) growth for the last four quarters has been: 5%, 34%, 31%, -53%. These are in stark contrast to the iPhone pattern shown in the outline bars behind Samsung’s.
Zach Epstein, writing for Boy Genius Report, notes that Samsung’s average revenue per tablet between between October of 2010 and March 2012 was approximately $450 per unit and $353 per smartphone sold.
Note that direct comparison between Apple’s and Samsung’s device performances would not be fair due to the different timeframes involved.
Care to share your analysis of these figures?
