![]()
Have you ever wanted to benchmark the graphics performance of your favorite Mac apps and games, or measure the refresh rates of macOS’s user interface?
If so, you’ll be delighted to learn that Apple provides a free application, called Quartz Debug, which has a built-in live frame rate monitoring tool that can measure the refresh rate of the graphics subsystem in frames per second (FPS).
Here’s how you can download Quartz Debug to your Mac and use it to display the number of screen updates per second, see the FPS and CPU gauges changing as you perform different actions on your Mac, enable HiDPI display modes on non-Retina Macs and adjust other settings related to the computer’s GPU.
Why knowing your Mac’s FPS is helpful
There are a number of situations when knowing an app’s refresh rate might come in handy. If you’re a gamer, for example, you might want to brag about how fast your brand spanking new Mac is. And for that, you’ll need Quartz Debug to determine the number of full-frame updates per second in games.
Or, you may be wondering whether or not you should disable Yosemite and El Capitan’s transparency effects, which will increase performance of the user interface on older Mac hardware.
If you own an ultra-high resolution external display or use a multi-monitor setup with your Mac, identifying bottlenecks in the graphics subsystem will help you adjust and optimize your daily workflow to maximize performance.
Or, maybe you’re writing a Mac app of your own and will use this indispensable tool to help debug graphics-related issues that might arise in your code.
How to measure Mac frame rates with Quartz Debug
Step 1: Visit the Downloads section of Apple’s portal for developers using your favorite browser. You will need to login with your developer Apple ID account. Folks who don’t have one needn’t become a member of the official paid Apple Developer Program as anyone can now create a free Apple Developer account.
Step 2: You’ll see a search field in the lefthand column of the Downloads webpage. Type in “Graphics Tools” in the search filed, then press Enter.
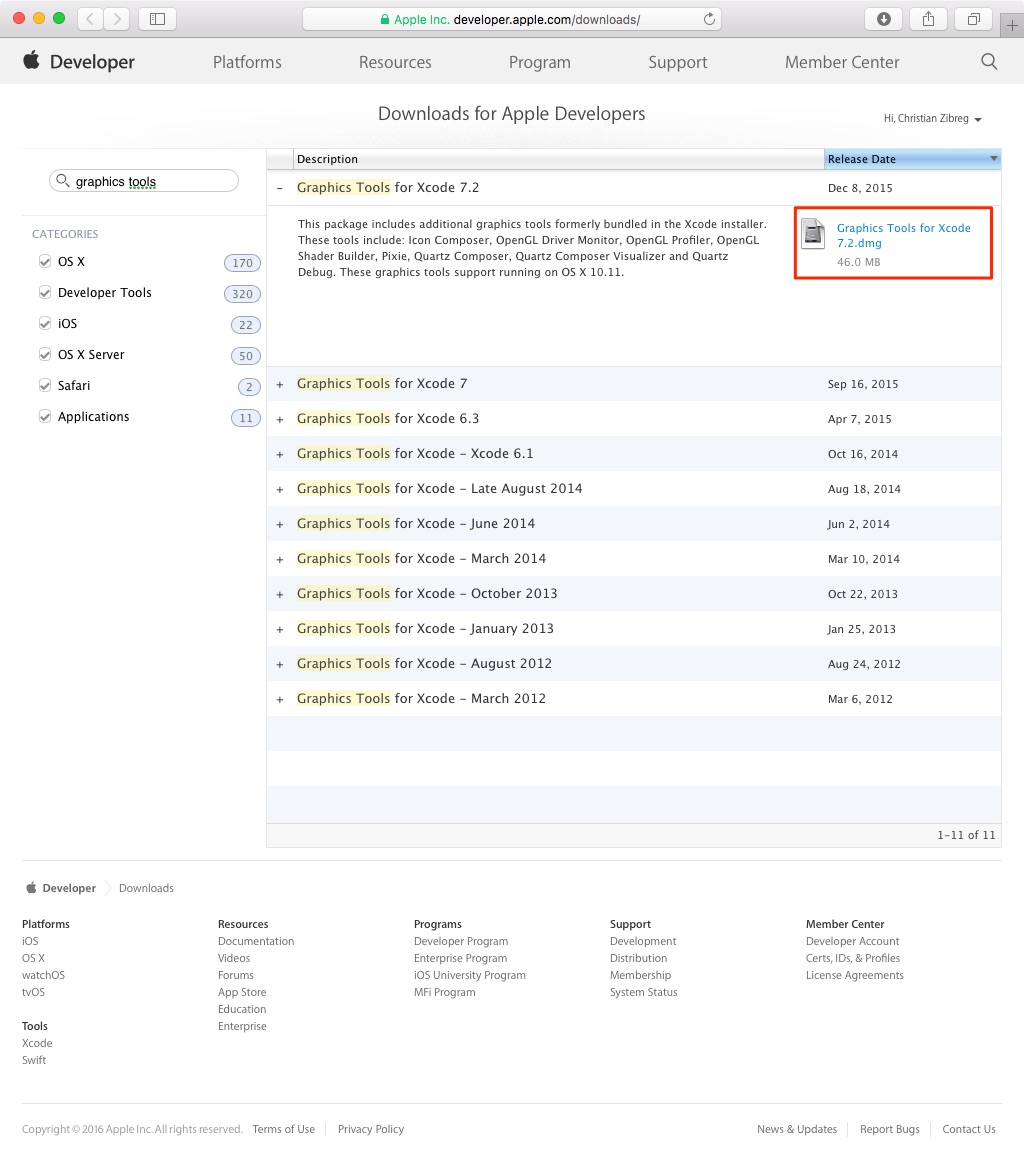
You will be presented with appropriate matches. Locate the version of Graphics Tools that’s suitable for your build of macOS and click the DMG file to download the installer.
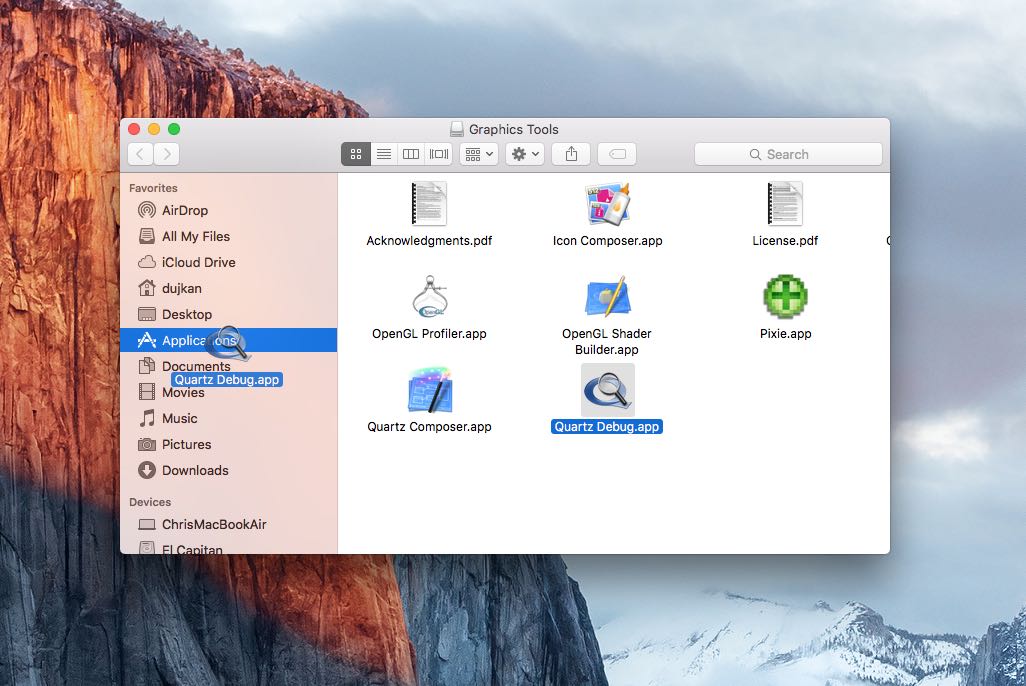
Step 3: After the installer finishes downloading, locate the DMG file inside your user account’s Downloads folder and open it to mount the volume on the desktop.
Step 4: Open the mounted volume “Graphics Tools” on the desktop and drag the Quartz Debug app into the Applications folder on your Mac.
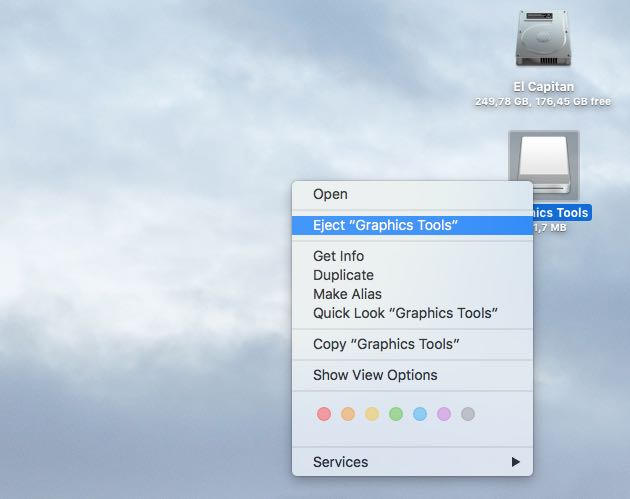
Step 5: You can now unmount the Graphic Tools disk image. Just right-click the icon on your desktop and choose Eject “Graphics Tools” in a drop-down menu.
Step 6: You’re now ready to use Quartz Debug. Use Spotlight to open the application or double click its icon inside the Applications folder.
Tip: To keep Quartz Debug in the Dock for quick access, right-click its Dock icon and select Options → Keep in Dock in the contextual menu.
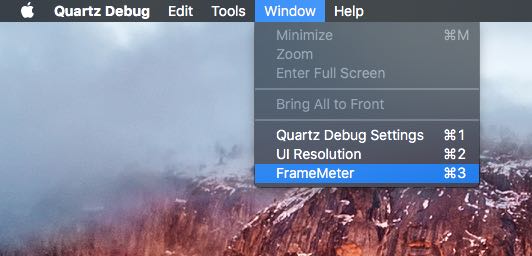
Step 7: Choose FrameMeter in Quartz Debug’s Window menu, or hit the Command (⌘) – 3 combination on the keyboard.
A handy CPU/GPU gauge should appear in an overlay, as shown below. Just drag it to the desired position before interacting with your Mac apps and the macOS user interface. You will notice that both the large GPU gauge and the smaller CPU gauge update dynamically to reflect the current screen refresh rate and CPU load.
As mentioned, the number of screen updates per second and CPU usage are useful metrics, not just for measuring FPS values in resource-heavy games but to decide whether or not you should disable some of macOS’s fancier animations, too.
Here’s a quick video showing Quartz Debug’s FrameMeter in action while scrolling iDownloadBlog’s homepage in Google Chrome.
You can also show the frame meter in Quartz Debug’s icon in the Dock, if you like.
How to show FPS in Quartz Debug’s Dock icon
Step 1: With Quartz Debug open, right-click its Dock icon.
Step 2: Choose Tools → Dock in the contextual menu to configure the frame meter and Quartz status in the Dock:
- Show Framemeter History—Choose this option to show the frame rate plotted on a graph which is displayed in place of the app icon in the Dock. The graph is updated ten times per second and colored by the most current FPS reading, with a red line representing an update rate of 0…30, a yellow line 31…60, and a green line 61…90 frames per second.
- Show Numerical FPS in Framemeter History—This will add the numerical FPS values to the graph in the Dock, with the maximum achieved frame rate shown in the parenthesis.
- Show Quartz Status—This option will display the status of macOS’s Quartz renderer in the Dock.
How to access advanced GPU options in Quartz Debug
To access advanced graphics options in Quartz Debug, select Quartz Debug Settings in the Window menu. A new panel will pop up, allowing you to toggle various option that pertain to graphics acceleration and debugging:
- Enable Quartz Debug—Enable or disable all options.
- Disable 2D Acceleration—Disable all 2D acceleration.
- Autoflush drawing—Flush contents after each drawing operation.
- Flash screen updates—Highlights regions of the screen before they update in yellow (normal). Regions that are under a DisableUpdate are painted orange.
- Flash identical screen updates—Highlights redundant screen updates in red. Redundant updates are those where a redraw of unchanged pixels occurs.
- No delay after flash—Removes the delay after flashing screen updates.
- Show tracking rectangles—Tracking rectangles are outlined in green. The active tracking rectangle is outlined in red.
Again, many of the options presented there may not be of particular interest to non-developers so best thing you don’t fiddle with them unless you know what you’re doing.
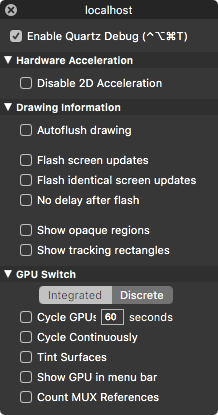
Clicking the GPU section at the panel bottom reveals additional options for integrated and discrete GPUs installed in your Mac. Use these settings to, for instance, enable the GPU option in macOS’s menu bar and more.
How to enable HiDPI display modes on non-Retina Macs
And last but not least, Quartz Debug lets you turn on macOS’s HiDPI display modes on older Macs that don’t have a Retina display. As a quick backgrounder, HiDPI values allow for control over the current scaling factor used for the user interface.
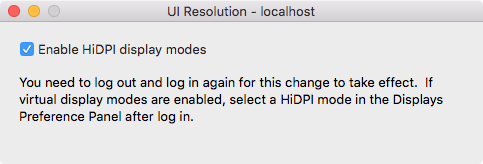
First select the UI Resolution option in the app’s Window menu and then tick the box next to the box Enable HiDPI display modes. When set, a new resolution is applied to the Dock immediately, but applications require a relaunch to pick up the new setting.
Wrapping it up
Let me point out that I am not a developer.
That being said, as an ordinary user I did find Quartz Debug’s FrameMeter tremendously useful in a variety of different situations, such as identifying refresh rates in games or to measure the GPU strain which occurs due to macOS’s visual effects and user interface animations.
I mostly use my mid-2013 MacBook Air a multi-monitor setup, hooked up to a 27-inch Thunderbolt Display. What Quartz Debug brought to light is what I’ve instinctively known all along—that iTunes is one of the biggest resource hogs on the Mac.
And imagine my surprise discovering that El Capitan on the latest MacBook Pros still suffers from dropped frames and performance bottlenecks because of GPU-taxing Retina screen.
If you don’t need the extra eye-candy in macOS, which on most Mac notebooks does bog down performance and yield poorer frame rates, disable macOS’s transparency.
Submit your how-to suggestions at tips@iDownloadBlog.com.