The recent launch of Status Board created quite a stir in the tech world. This iPad display has turned heads all around the Internet. It is not just because the app looks good, which it does. It is also because the app is fully customizable and allows for user data input of any kind that can even be shared with others.
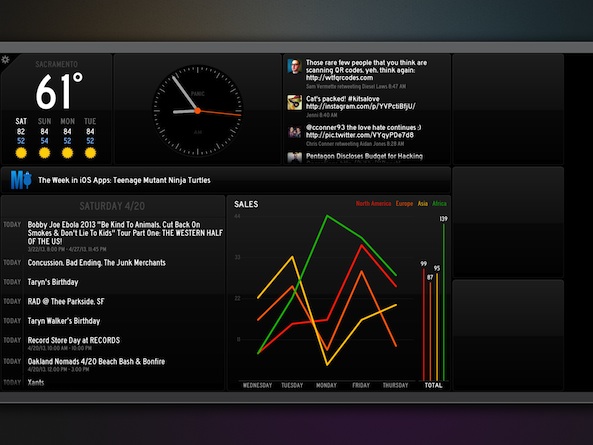
Status Board is a data display that allows users to see various panels of information, all on one screen. You can see tweets, calendar events, news feeds, email, and much more. You can customize graphs and tables and even make your own panel using HTML. Once you’ve created your board, you can display it on your big-screen TV using Apple TV AirPlay Mirroring or with an HDMI cable and iPad adapter. Status Board is the ultimate data collection display panel…
Design
The whole point of this app is its design, so it is a good thing that it is excellent. The entire display is based on a shadowed black theme with rounded corners and a modern, businesslike look. Bold colors from the graphs and tables stand out against the stark background. The font is bold white with subtext in gray.
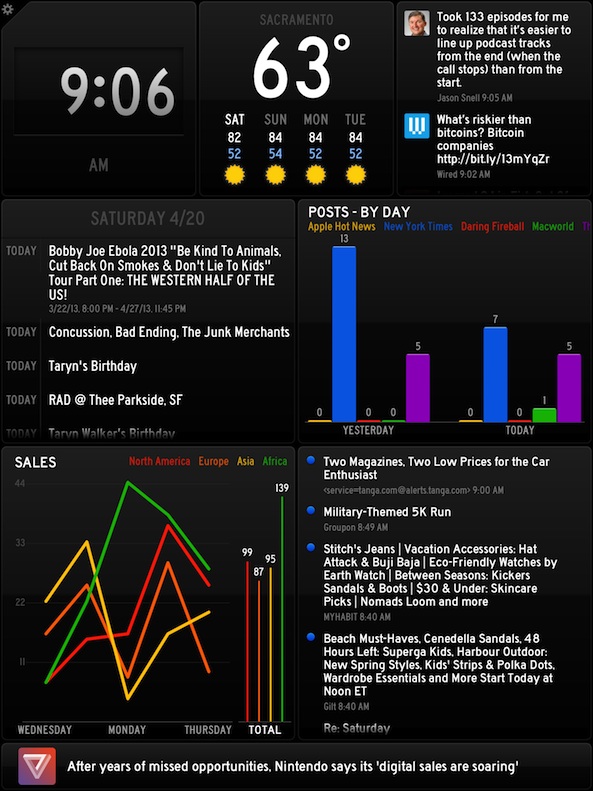
Since it is the user’s job to design the display, it is up to you to make it look the way you want. You can make the weather section huge and the Twitter feed a ticker, or make your business graph take up the entire bottom of the screen while showing the time, your RSS feed, and your email across the top.
You can display your newly designed board either as a full-screen iPad image, or as wide-screen HDTV. The HDTV feature is for displaying the board on a large screen TV. However, to access the full image, it costs an additional $9.99. Don’t worry, you can still show your beautiful status update display on your big screen using Apple TV and AirPlay mirroring. It will show up as a letterbox display instead. Personally, I think it looks great that way, but I can see how some businesses would want to upgrade to full HDTV to show off their board at the office.
App Use
Depending on your level of business needs, this app is either the easiest display app ever, or something that will take a bit of work. If you just want to see your Twitter feed, RSS updates, the local weather, the time, and your calendar events, you just have to add the panel. If you want to include your own graphs, tables, or DIY panels, you will need to follow a couple of additional steps. The good news is that there is a tutorial for everything.
To add a clock panel, touch the clock icon at the bottom of the screen and drag it to the board. You can place it anywhere and then resize it according to your personal taste. You can switch between analog and digital by tapping the newly added panel. Tapping a panel allows you to edit it. If the clock is set to New York Time, but you want it to show California time, change the location in the edit screen.
Do the same thing with the weather panel. Drag it to the board and tap it to edit. You can switch between Celsius and Fahrenheit and change the location.
Adding the calendar app is as easy as allowing your iPad to access it. If you didn’t see the pop up access request when you first opened the app, you can manually allow Status Board to access your calendar by going to your settings app, selecting Privacy, and then Calendar.
To add your mail account, you must enter your username, password, and IMAP server. I use Google Mail and the IMAP information automatically added when I entered my email address. I’m not sure how it works with mail servers like Outlook.
Adding Twitter is just as easy as adding the calendar. If you’ve allowed Status Board to access your Twitter account, you can then edit what feed you see on your display. You can view your personal tweets, timelines you follow, how many followers you have, mentions, and a feed for a specific search term. You could have an entire Status Board dedicated to nothing but Twitter.
If you want to add an RSS panel, you can chose from a short list that Panic has already included, or add your own websites using the site or feed URL. The thing I don’t like about this is that I have to manually add my favorite RSS feeds. I follow a lot of them and it would be great if there were a way to search popular feeds or select websites within certain categories. I know this is not an RSS reader, but manually adding the URL for every website I follow is an arduous task.
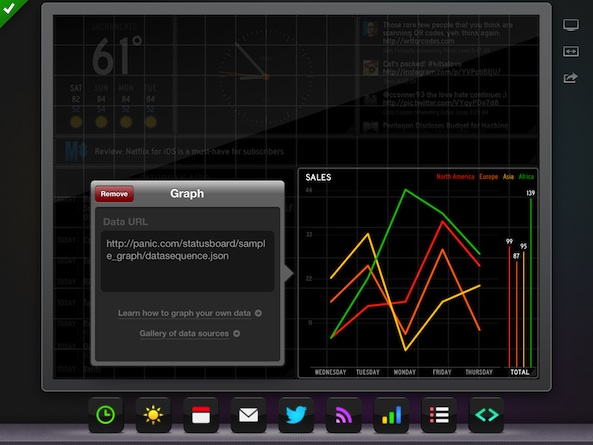
To add a personalized graph, you can create a spreadsheet using Excel or Numbers, save it as a CSV file, add it to a web server, and then open it in Status Board. I am not a businessperson and have no need for graphs in my daily life, so I was a bit intimidated to try this.
However, Status Board includes a very comprehensive step-by-step guide to creating CSV graphs and adding them to the app. I was able to create a monthly sales graph for my record label in just a couple of minutes. The app also allows for creating JSON graphs. However, that was a little beyond my abilities. If you use JSON formatted graphs, the tutorial explains how to add them to Status Board.
You can also add your own data table in a very similar way to making a graph. You can add a simple data table using CSV formatting, or create a richer visual table using HTML. If you don’t know how to use HTML coding, the app’s tutorial includes some simple instructions and even has the coding text for a sample table.
You can also create your own panel using HTML coding from an outside web page. Make a BART schedule panel, or a ski report panel. Follow the app’s tutorial to get the panel to match the appearance of Status Board. One of the best aspects of the DIY panels is that there are already a bunch of them popping up on the web. Panic has added a list to their blog and there are even third-party websites being created specifically to list Status Board DIY panels. I added an AAPL stock tracker from Maccast by simply opening their link from within my iPad’s Safari browser.
I left Status Board open and running for about five hours without charging my iPad and it only drained down about 30 percent. For such a data-heavy app, I was surprised to see that it didn’t suck up more of my battery life than that.
The only issue I have is that I can’t have more than one Status Board at a time. If you want a board dedicated to your work data and a different one dedicated to your personal life, you’ll have to delete one in order to create another. I’d like to see Panic add the ability to have multiple boards.
Value
This is a pricey productivity app at $9.99. If you just want to look at a clock and weather board, you may not want to spend the money. However, if you are a fan of data collection, or are the kind of person that creates graphs for fun, this is worth the high price. If you run a business and want to keep track of your sales figures, inventory status, or any other data collection information, you may benefit from spending the extra $9.99 on the full HDTV in-app purchase so you can display your board in your office.
Conclusion
Status Board may be the best looking and most useful productivity app to hit the App Store to date. The reason it is such a great product is that you can create your own data panels using whatever information you want. You are not beholden to the developer’s idea of important information. Because of its high price tag, I can’t recommend it for everyone, but if you see yourself benefiting from creating various data graphs, tables, and panels that can be displayed on one screen, then the app is worth the price. Download it in the App Store today.