The folks over at App of the Day have put together a nice, comprehensive infographic on the state of the App Store. Their work is based on the App Store as of December 7, 2010.
The infographic addresses overall statistics and some insightful numbers on the mechanics of how the App Store operates.
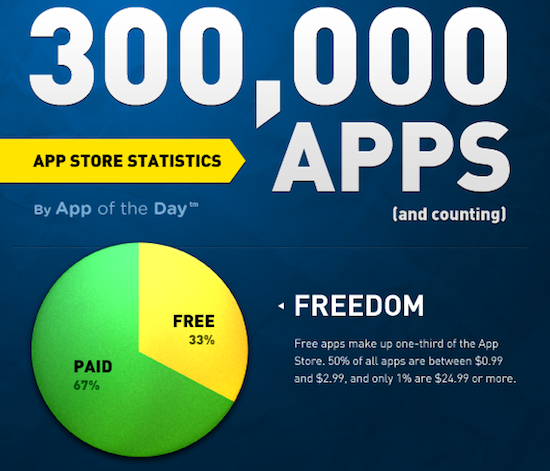
For instance, out of the 300,000+ apps in the App Store, 85% are for the iPhone only. 67% of apps are paid and 33% are free. There are more universal apps than there are iPad apps. Out of all apps, 50% are between $0.99 and $2.99… 
There’s also an interesting distribution of App Store categories in the infographic. It’s no surprise that games and books are the largest categories. There are about 50,000 book apps alone, and almost 7,000 of them come from a single developer (that guy’s busy).
Specialized categories, like medical apps, have very low saturation, but high-priced downloads make up for the smaller install base.
The average price of an App Store app is $2.43. The average rating of an app is three stars. The official Facebook app is the only app with over 1,000,000 ratings.
There are 62,126 unique developers represented in the App Store. That’s pretty stunning.
The guys at App of the Day did an awesome job with this infographic. The statistics are informative, and the graphic looks great.
I was surprised at how many book apps there are. What do you think about these numbers? Does anything surprise you?
[App of the Day]