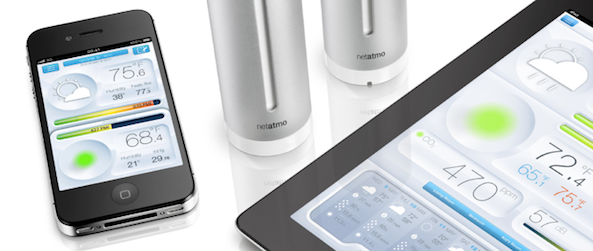
I love the weather. No real reason in particular, but fascination started as a young child when I would rush home from school to track Hurricanes on the Weather Channel, despite living nowhere near the coast. When I first read about the first iOS specific Netatmo Urban Weather Station a month back, I was fascinated with the ability to monitor the temperature, both in and outside my house. A weather nerd at heart, I think this is an awesome piece of hardware. To the weather novice, it is still a great addition for your connected home. Below, we take a look at the personal weather station that just received CES Innovations 2013 Design and Engineering Award honoree in three categories…
Hardware
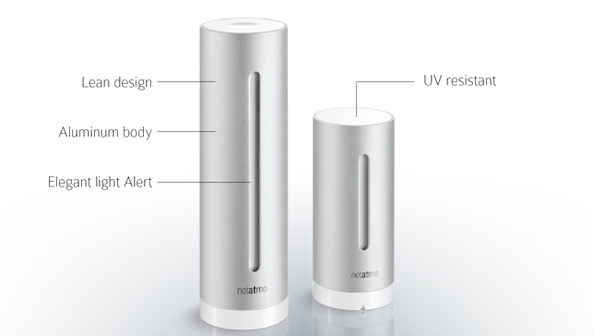
Both of the Netatmo hardware sensors are crafted from a single piece of aluminum with UV resistant plastics on the top and bottom caps. The indoor sensor stands 6 inches tall and is approximately 1 inch in diameter, where the outdoor sensor is 4.1 inches tall with a similar diameter. Another contrast is the power source, which is AC power on the indoor model and battery (included) power on the outdoor. My one concern about the outdoor model is the battery compartment, which houses four “AA” batteries. The bottom cap, while tightly screwed, does not have a gasket seal to prevent moisture collection in the battery compartment, which over time, may cause corrosion and potential failure of the unit.
Keeping the outdoor unit away from the sun is important for two reasons, one, wear and tear on the module and two, accurate weather readings. The included instructions encourage the user to place the unit below the roofline on your house to protect it from direct sunlight. Having used the units for about two weeks, I can vouch for the importance of the directions. Everyday it is sunny, my 1:15PM reading is spiking around 95 degrees Fahrenheit, which is exactly the time the unit has been in the sun the longest. To help the installation process, Netatmo includes a velcro strap or anchored screw to place the unit somewhere out of direct sunlight and rain.
Software
Setting the device up required a little trial and error complications as the directions both with the hardware and on the app are merely images. Once plugging in and installing batteries, download the Netatmo app. Further setup instructions, including information on how to connect the hardware to your home network is included in the initial stages of the app. I started the setup using my iPad mini, but the USB to Lightning connecting kept failing and after I consulted the box, noticed no new Lightning iDevices are compatible yet. After stealing the iPad 3 from my wife, I was able to get things up and running very quickly.
A little helpful advice, make sure to pay attention to the iPad/USB connection. First, connect the 30-pin connector, then connect it to the indoor unit or the connection will not remain active during the installation process. This is shown in the picture directions, but, being a typical man, I just rushed through everything and overlooked that detail. Having numbered directions, in addition to the images, would be a nice touch. Once setup is complete, both units will connect to the designated Wi-Fi network and report information, at 5 minute intervals, to the Netatmo online server system.
Through the free Netatmo app, the user can view the indoor air quality, humidity, temperature, outdoor air quality, CO2, acoustic comfort, barometric pressure, and local weather. However, the units are not actually pushing this information directly to your iDevices. Netatmo’s hardware sensors send the gathered information to the online server system, then the app pulls it down to the iDevice for viewing. The server storage is free and has no data limit or subscription fee for usage. For in-depth information about the Netatmo software and hardware capabilities, visit the product specification page.
Dashboard
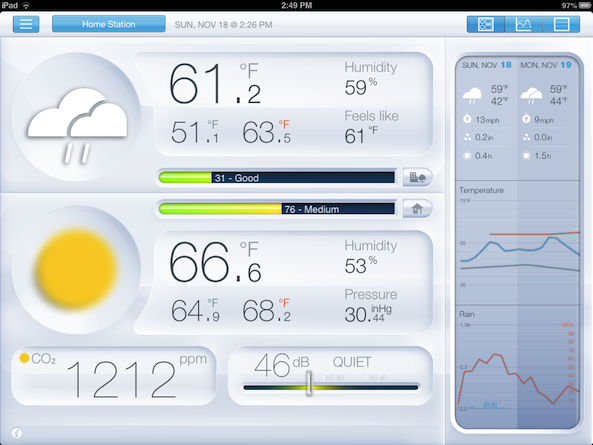
On iPad, the app dashboard displays every piece of information gathered by both units, but on iPhone, the indoor and outdoor information is displayed on different screens. For the sake of the article, all app layout descriptions will discuss the iPad layout. An information button located on the bottom left of the dashboard will pop up and overlay with the dashboard, helping educate the user on each different piece of information.
On top, the outdoor information is displayed with the current weather first, using a graphic representation, then the current temperature, predicted high/low, current humidity, “feels-like” temperature, and current air quality reading. These readings are a mixture of local information pulled by zip code and actual measurements from the outdoor unit.
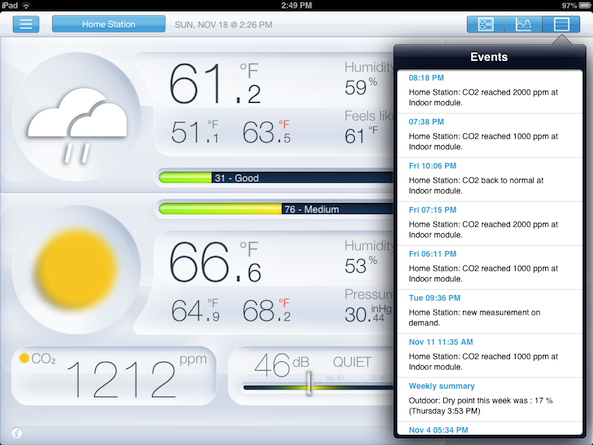
The bottom includes a graphical representation of the indoor CO2 levels (air quality), current temperature, predicted high/low, current humidity, barometric pressure, and decibel level reading. These indoor and outdoor readings are paired with a pulled report based on zip code for the seven day forecast. Personally, I did not see the advantage to knowing the indoor CO2 report, but according to the app, low CO2 levels cause sleepiness and frequent headaches. I also, now, understand the importance of cracking a window when burning the gas logs. Each time the logs burned for too long, I would get a push notification, or “Event,” that the CO2 levels had drastically increased, even in a room away from the fireplace. Venting the house by opening a window will return the CO2 to an acceptable or “comfortable” level.
Graphical Representation
In addition to the Quick Look dashboard, a graphical representation of indoor (temperature, humidity, pressure, CO2, sound) and outdoor (temperature, humidity) are displayed. Using the graphs can help pinpoint specific occurrences throughout the day. If you are looking to determine when to program your thermostats to knock off the morning chill in the winter or cut down the AC in the winder, the graphs can help look for indoor and outdoor weather trends. An example of these graphs can be found in the announcement video below.
I would like to see a “jump to date” option on the graph or a “today” navigation option. When looking back through gathered information, there is no current way to navigate without simply scrolling left and right between weeks of readings.
Conclusion
Is it worth it? That is always the biggest question when it comes to reviewing a product. Even as a huge weather geek, $179.00 seems like a big bite to chew on this weather station. Do not get me wrong, here. The functionality is great. Free cloud storage every 5 minutes is amazing. Setup without a computer is even better. On demand, one touch, accurate readings is appreciated. But, even with all of these great advantages, I cannot see myself wanting to purchase this information at such a premium.
I can get the temperature and seven day forecast in my zip code for free using other weather apps. I can tell if it is raining by looking outside. My thermostat tells me how hot or cold it is in the house and, really, how often is the CO2 level in your house an issue? Carbon Monoxide, yes, that is a big deal, but Netatmo does not check for that gas.
The Netatmo is a novelty product for certain, but it is a fun and downright accurate weather station. I am excited my friends at Netatmo sent one over for review and look forward to catching up with them at CES 2013. If you are looking for a way to get personal weather information, on demand, on your iPad, iPhone, iPod, and look at graphical histories of that information, run to the product page and buy a Netatmo weather station. There is not a lot of competition in this connected home category for weather stations. Netatmo does a great job implementing exactly what they intended to do: give the at-home user an accurate, reliable, and personal look at their weather, both inside and out, to enhance their knowledge and lifestyle in regards to that information.
The Urban Weather Station is purely a rich man’s lust at that price, or a great gift! Thanks to a little insider information, I happen to know how you can score a discount. If you order between November 23 and 26, use code “FRIDAY2012” for a 15% discount or between November 26 and December 31 use code “XMAS2012” for a 10% discount. You’re welcome!
Pros:
- Reads information every 5 minutes and stores indefinitely, for free
- No subscription fees
- Easy setup, on 30-pin device, no computers required
- Free app uses dashboard to display all information at a glance
- Push notifications for important changes
Cons:
- Expensive
- Outdoor unit cannot be in direct sunlight because the metal housing gets extremely hot and gives inaccurate measurements
- Battery gasket lacks rubber seal, may allow moisture
Do we have a lot of iDB weather lovers out there? Would you be interested in a device like this to monitor your personal weather information? Does anyone have a product like this already that they enjoy?