The Activity Monitor on your Mac is one of those tools that you should become familiar with. You by no means need be an expert on it, but you should know the basics. Why, you ask? Because the Activity Monitors shows all the processes running on your Mac. It’s like a task manager, so you can see how those processes affect your Mac and close any if needed.
Whether you’re new to Mac or simply new to the Activity Monitor, we’ll walk you through the basics you need to know.
Access the Activity Monitor
Pop open the Activity Monitor so you can take a look at what we’ll discuss.
You can open it from the Applications > Utilities folder or using Spotlight.
Activity Monitor categories
The Activity Monitor is comprised of several categories including CPU, memory, energy, disk, and network. You can see active or background processes necessary to run your apps and system within each category.
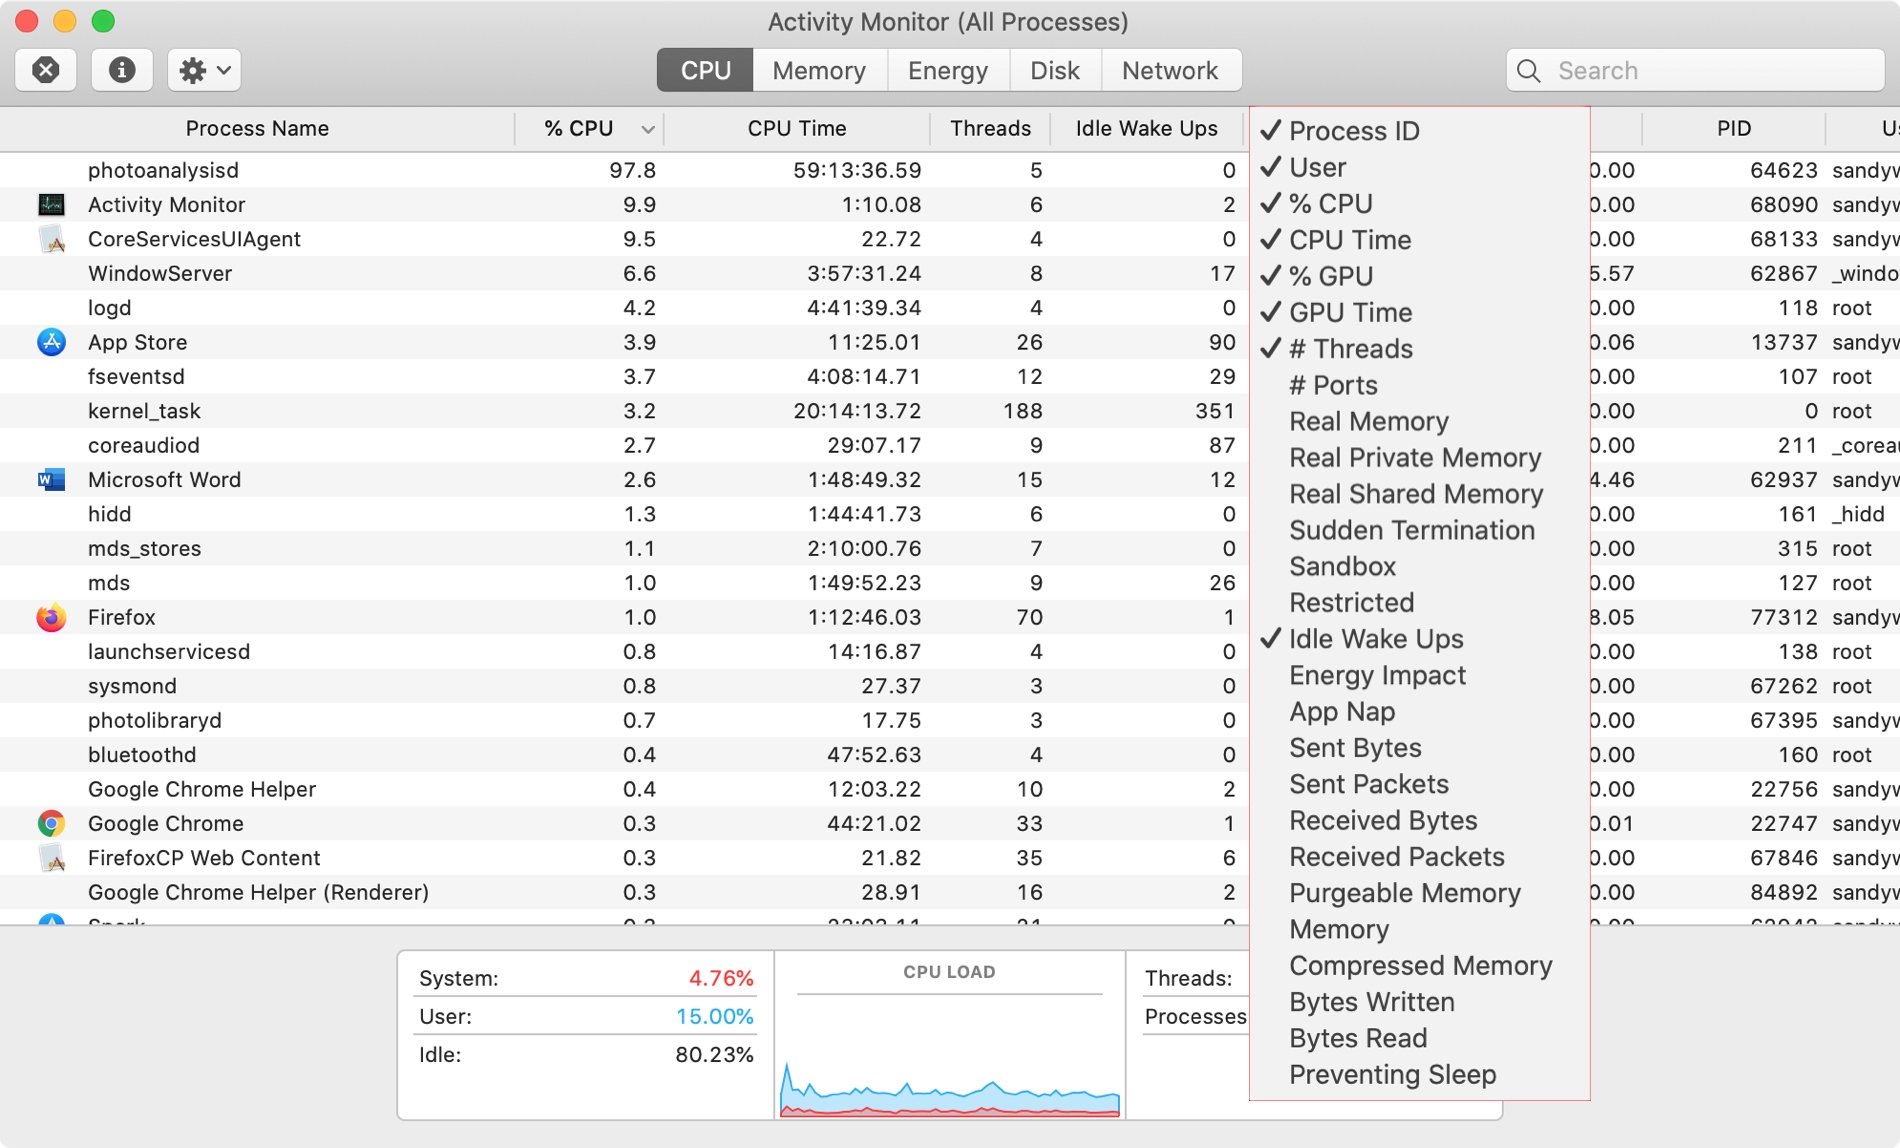
CPU: See which processes are affecting your Mac processor.
Memory: View how your Mac’s memory is being used.
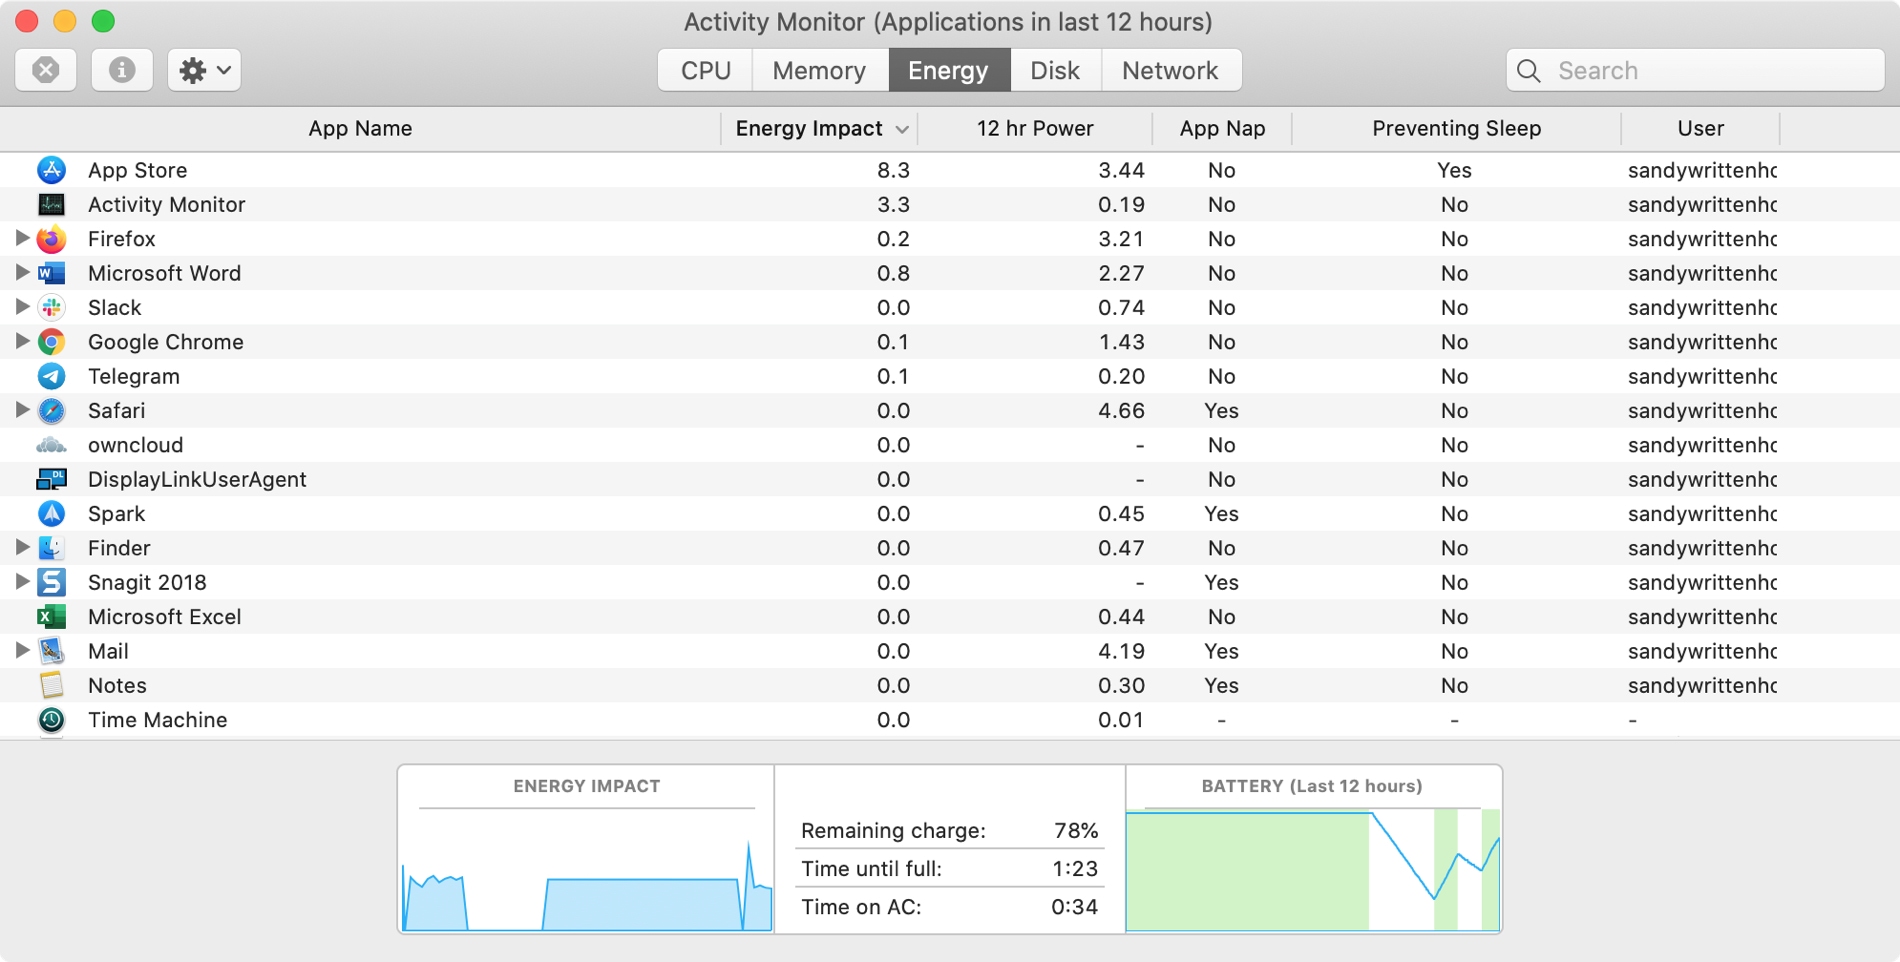
Energy: Review which apps are using energy and how much.
Disk: See how much data each process reads and writes to your disk.
Network: View how much data your Mac is sending and receiving over your network.
Activity Monitor data
As you select each of the above categories in the Activity Monitor, you’ll see a table of data, which can be sorted by column. The column headers you see can be customized. Just right-click on a column header and then check or uncheck those you want to see. To rearrange the columns, just select and drag them where you want them. And you can customize the columns per category as well.
You also have handy graphs and additional data summarized at the bottom. For instance, on the CPU tab you can see how many total processes are running and on the Energy tab, you can get details on your battery.
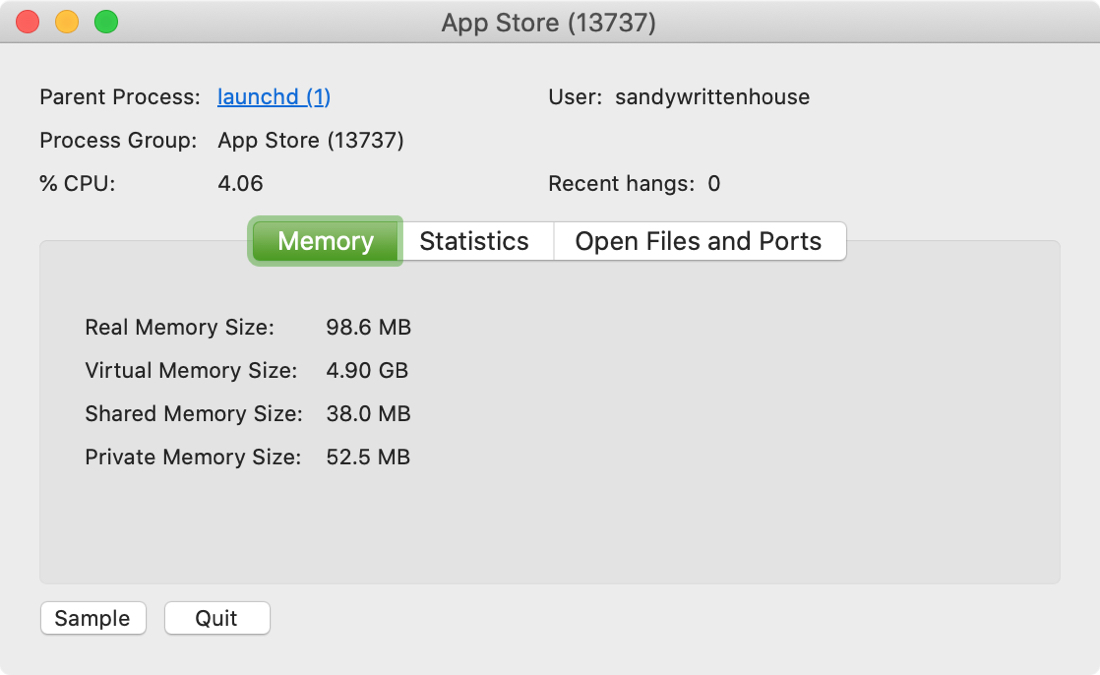
If you see a process and want more information on it, select it from the list and click the Inspect selected process button in the toolbar or simply double-click the process. You can then view the parent process, percent of CPU it uses, memory, statistics, and open files and ports.
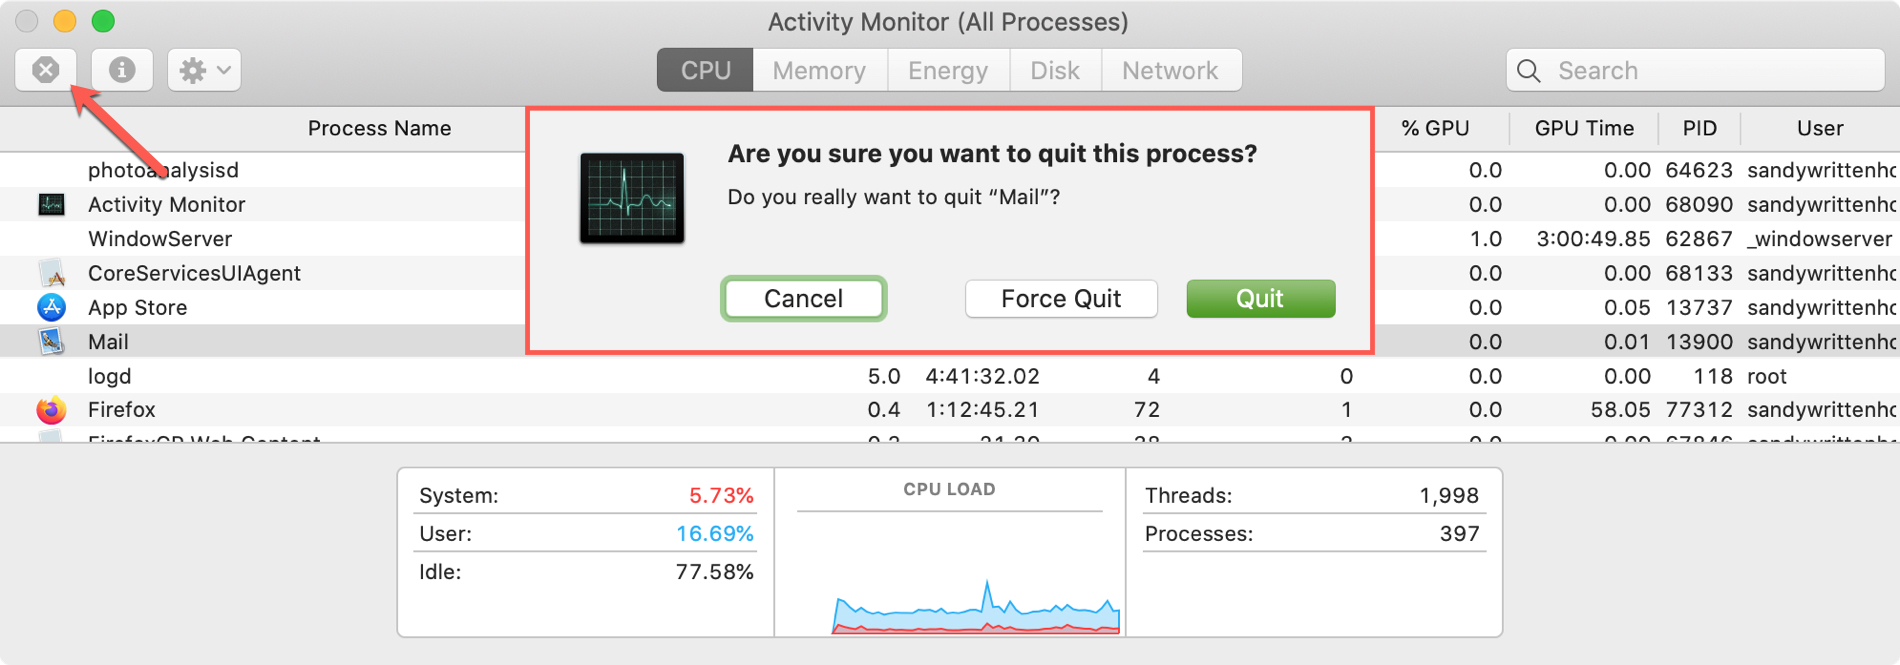
To stop a running process, select it from the list and click the Stop button in the toolbar. You can then choose to Quit or Force Quit the process. You can also Quit a process in the information window described above.
If you want specific information on data for a particular category, you can check out Apple’s Mac Activity Monitor guide.
Wrapping it up
Again, the Activity Monitor is a good tool to become familiar with on your Mac. If you’re wondering what’s sucking up all the energy on your computer or what’s consuming all of the memory, pop open the Activity Monitor and have a look so you can take action.
Will you remember to check the Activity Monitor the next time you have a question about a process running on your Mac?