If you’re a web developer, then you likely already know about Safari’s Web Inspector. But if you’re just starting to use Safari for development or have just begun your Web Development career, this guide will show you the basics for getting started with the Safari Web Inspector on iOS and Mac.
What is the Safari Web Inspector?
For those not yet familiar with the tool, you can use the Safari Web Inspector for help with your web development. It allows you to review page elements, make changes, troubleshoot problems, and review page performance. Apple sums it up with:
Web Inspector is the primary web development tool in Safari. Web Inspector allows you to inspect, tweak, debug, and analyze the performance of your web content in a Safari tab.
Enable and open Safari Web Inspector
You can use the Safari Web Inspector for development on your iPhone, iPad, or Mac. Here’s how to enable and open it on iOS and macOS so you’re ready to use it when you need it.
On Mac
If you’re going to use the Web Inspector frequently, whether for iOS or Mac, you might as well add the Develop tab to your menu bar so you can access it easily.
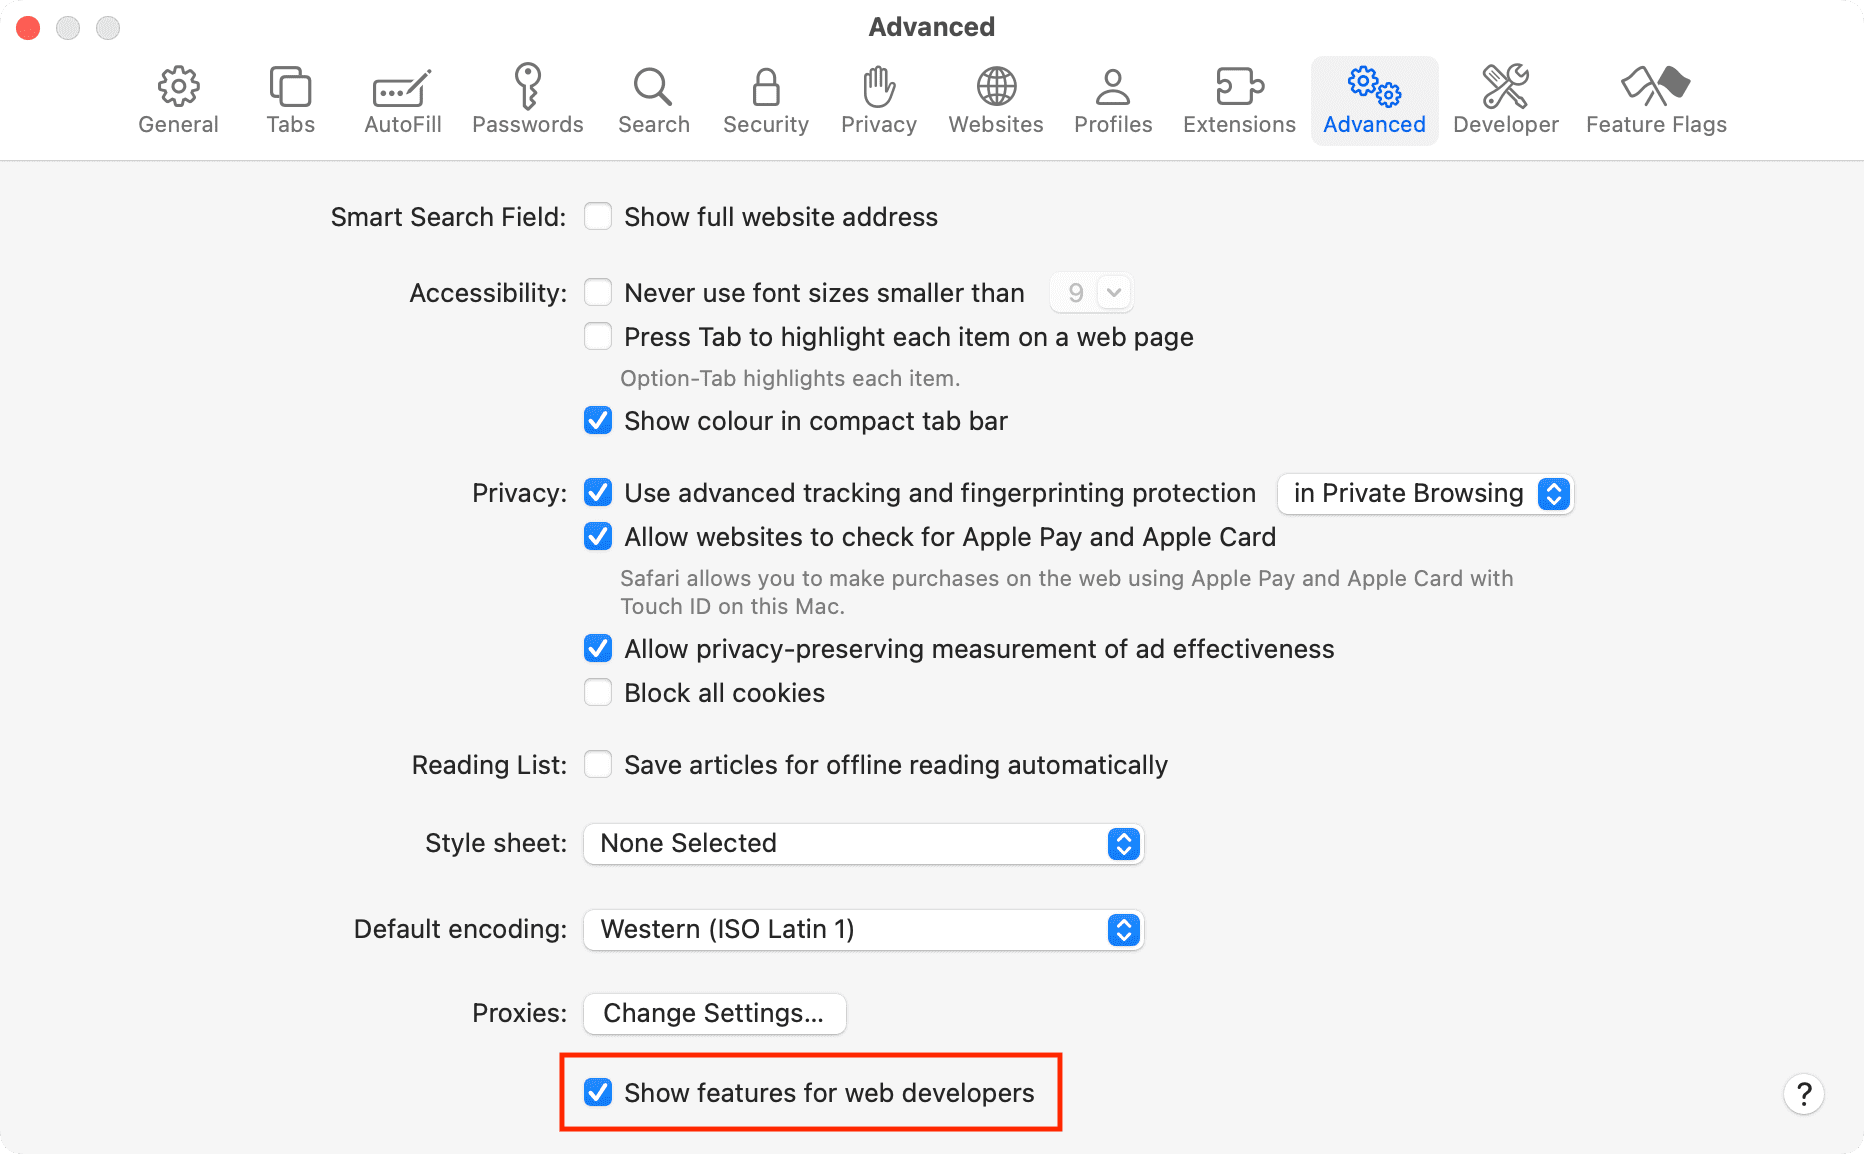
- Open Safari on your computer and click Safari > Settings or Preferences from the menu bar.
- Choose the Advanced tab.
- Check the box at the bottom for “Show features for web developers” or Show Develop menu in menu bar.
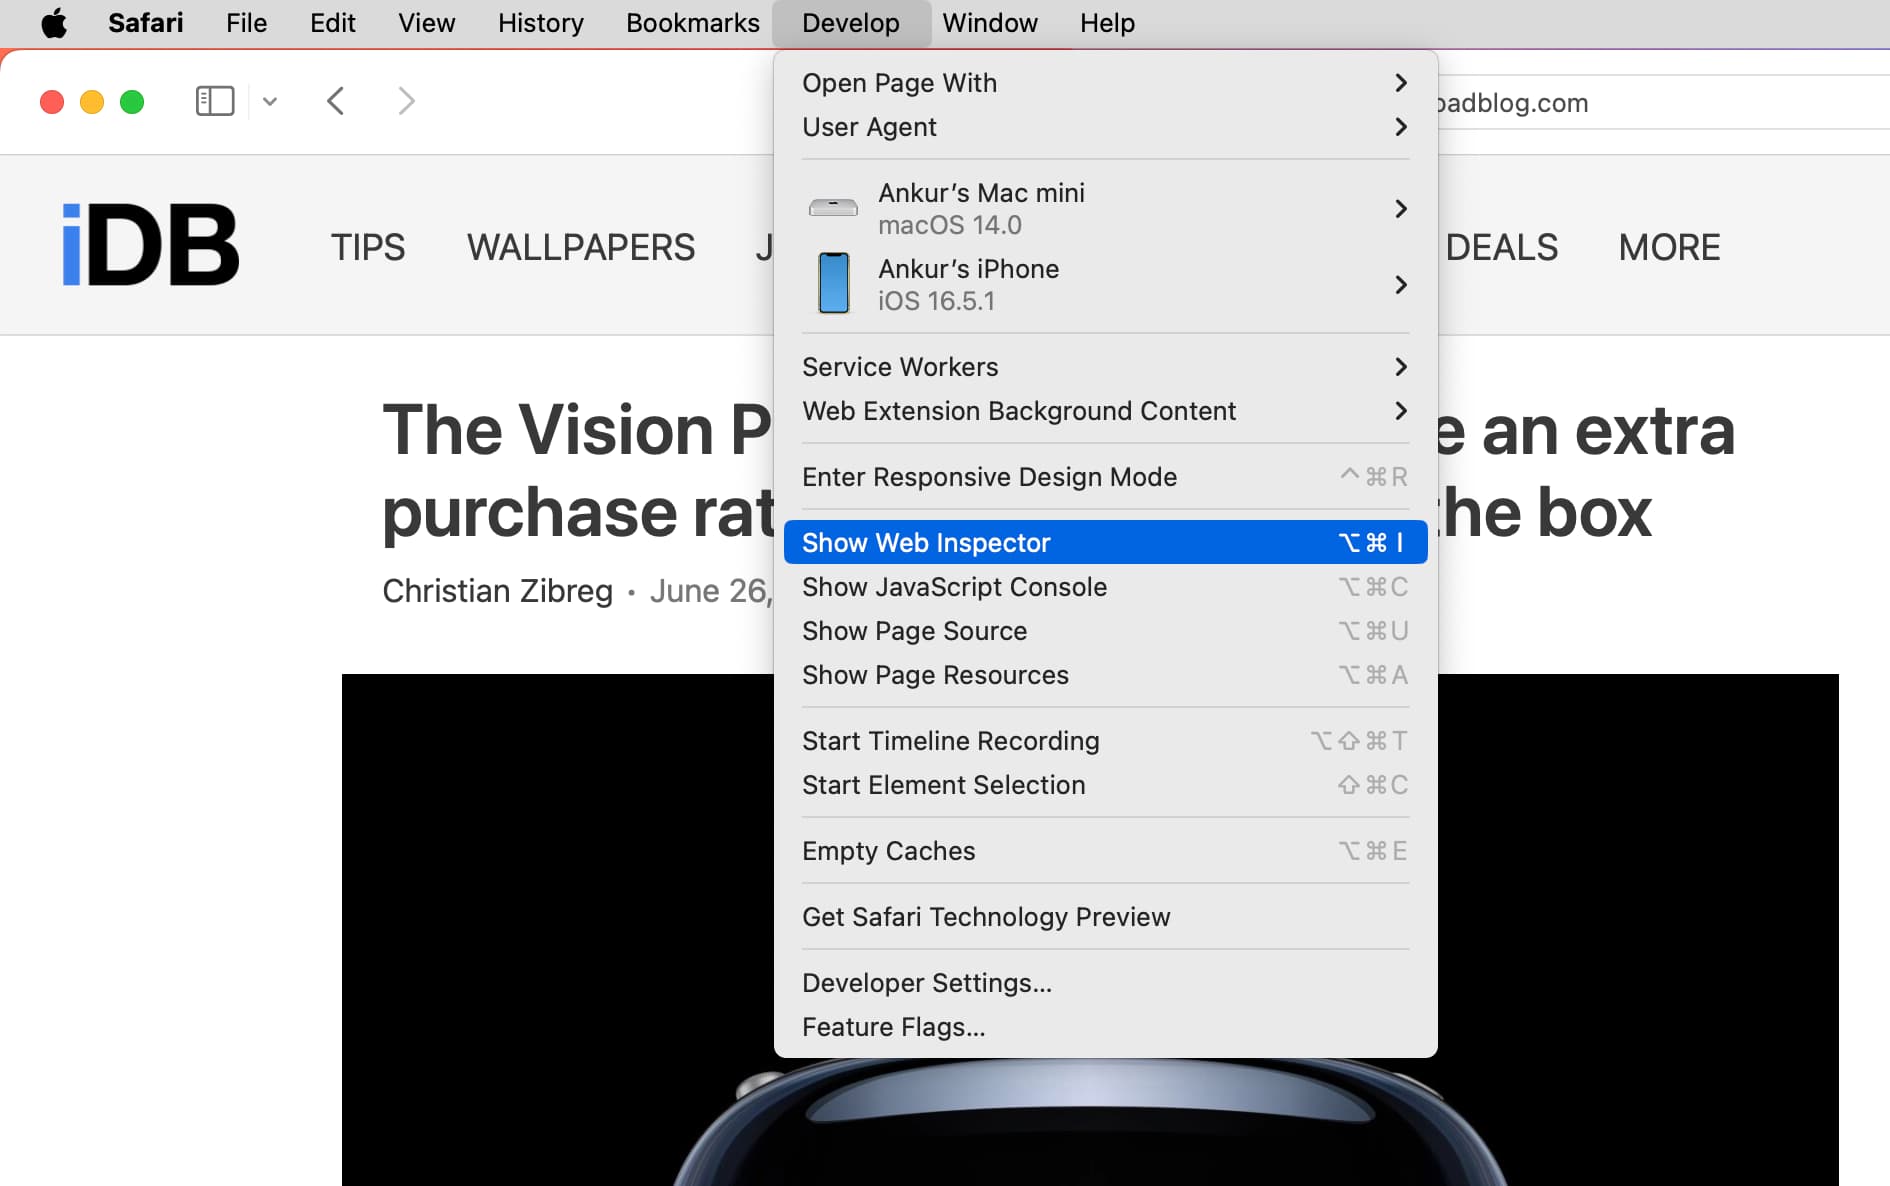
Now when you want to enable the Web Inspector, click Develop > Show Web Inspector from your menu bar.
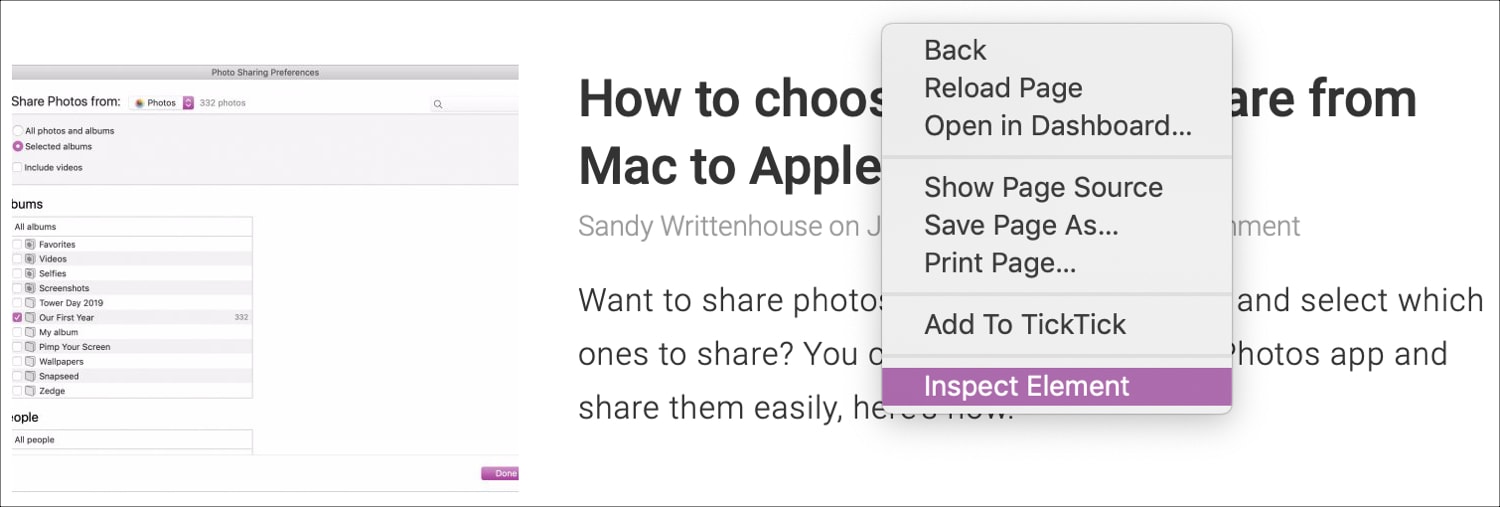
If you prefer to forgo adding the Develop button to your menu bar, you can access the Web Inspector on Mac with a shortcut. Navigate to the page you want to inspect, right-click on it, and pick Inspect Element from the context menu.
Just keep in mind that if you plan to use Web Inspector for Safari on your iOS device, you’ll need the Develop button in the menu bar on your Mac.
For iPhone and iPad
To use the Web Inspector for iOS on your Mac, grab your USB cable and connect your iPhone or iPad to your computer. Then, follow these steps to enable the tool:
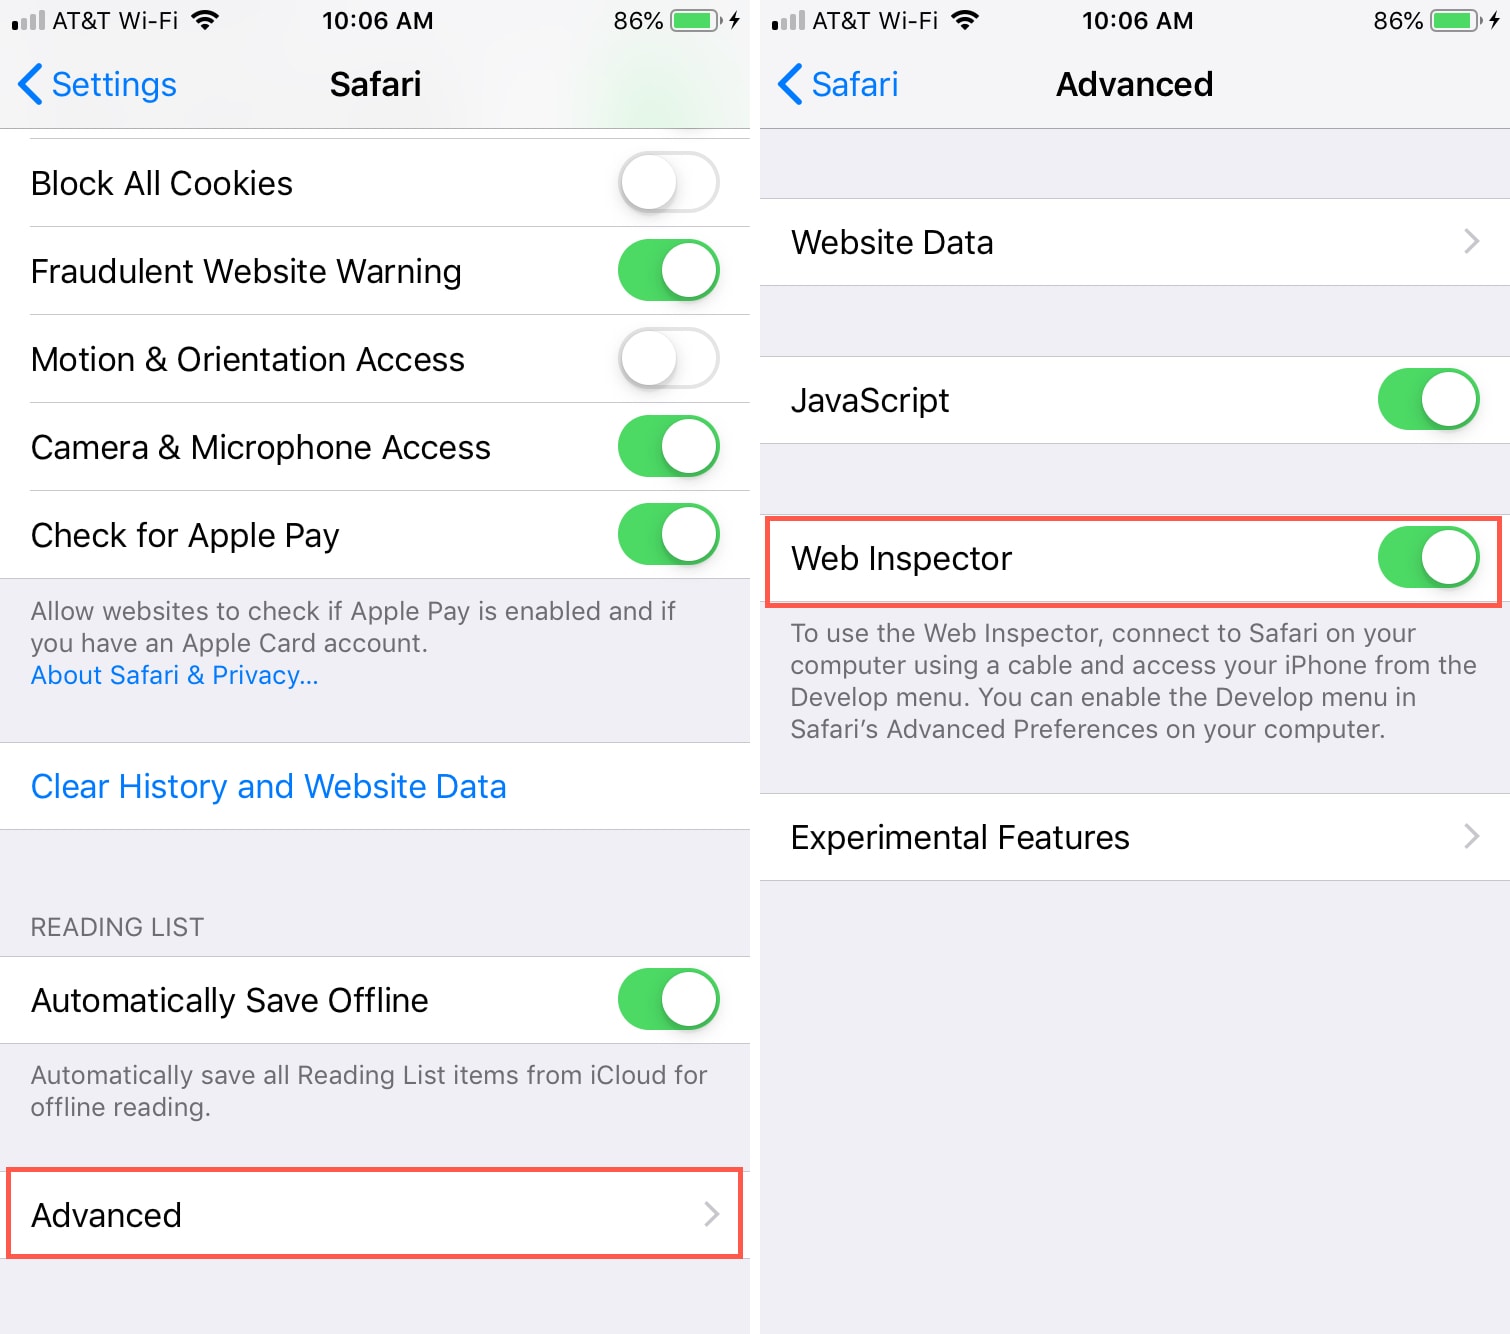
- Open the Settings app on your iPhone or iPad and tap Safari.
- Scroll to the bottom and tap Advanced.
- Enable the toggle for Web Inspector.
Next, make sure Safari is open on your iOS device and your Mac. After that, follow these steps:
1) Click Develop from the Safari menu bar on Mac, and you’ll see your iPhone or iPad listed here.
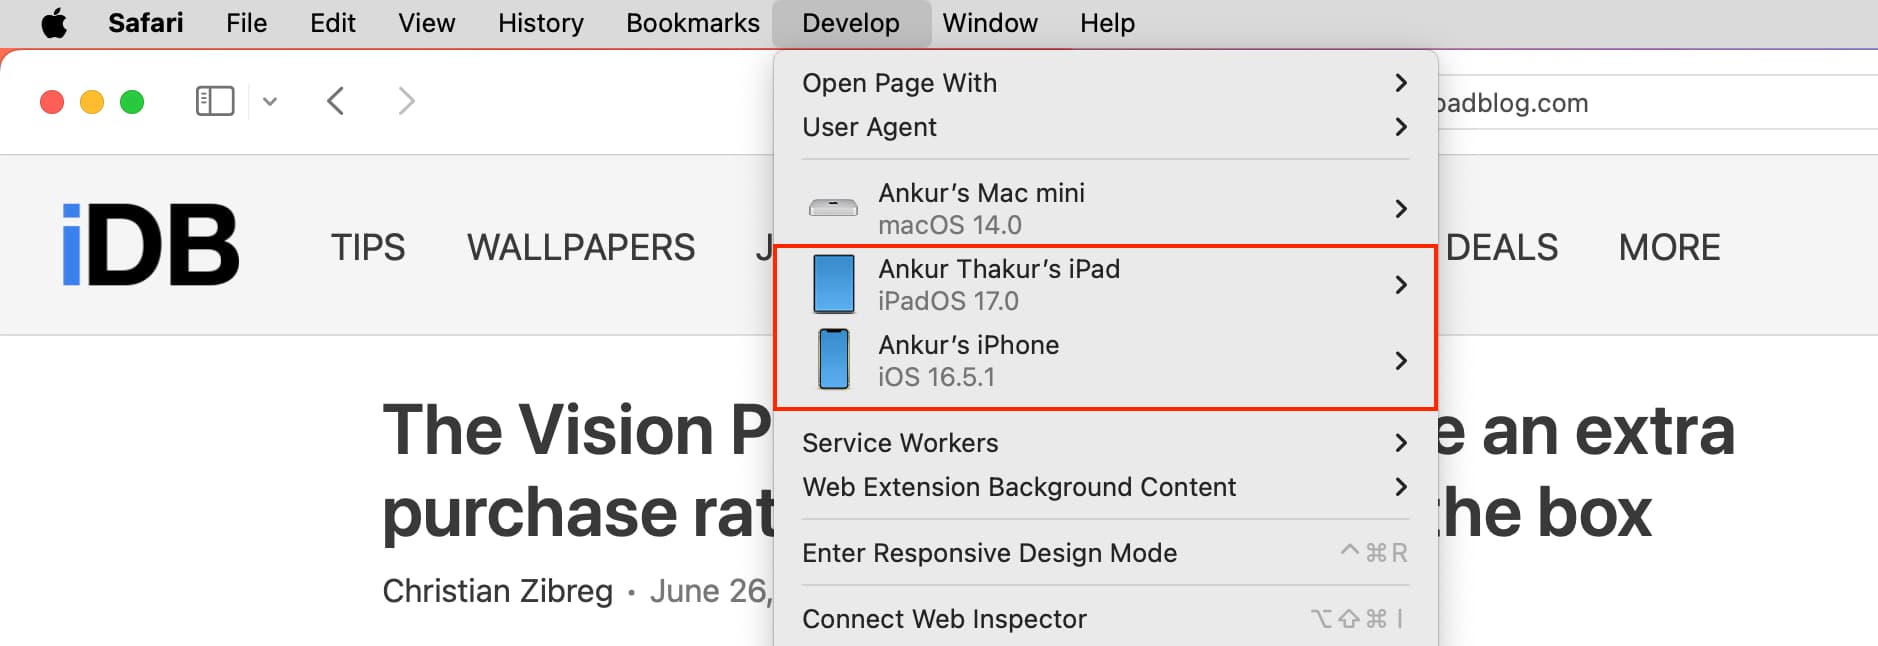
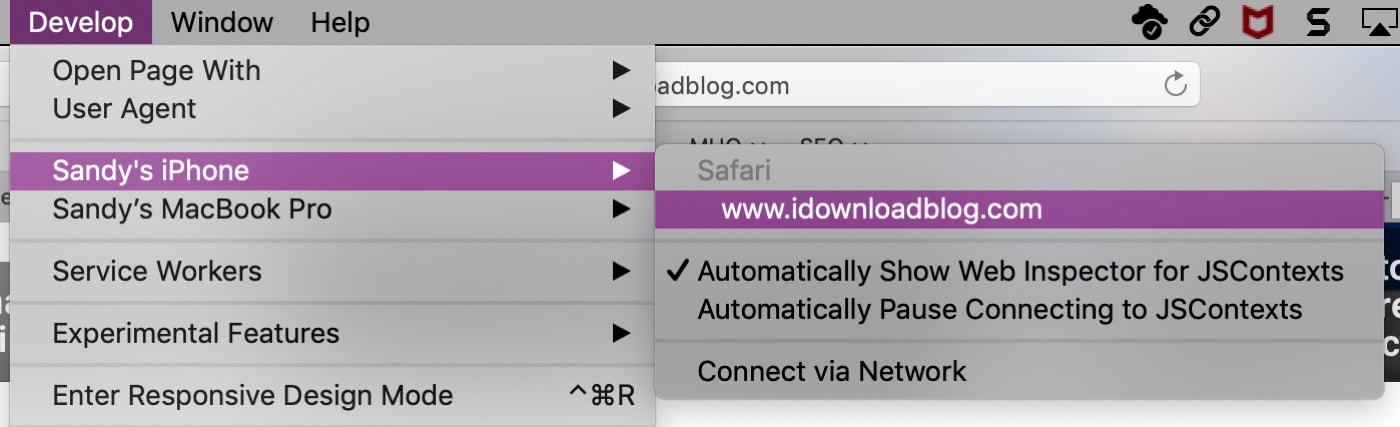
2) Mouse over the device, and you’ll then see the websites open in Safari on your mobile device.
3) Select the one you want, and the Web Inspector will pop open in a new window for you to use.
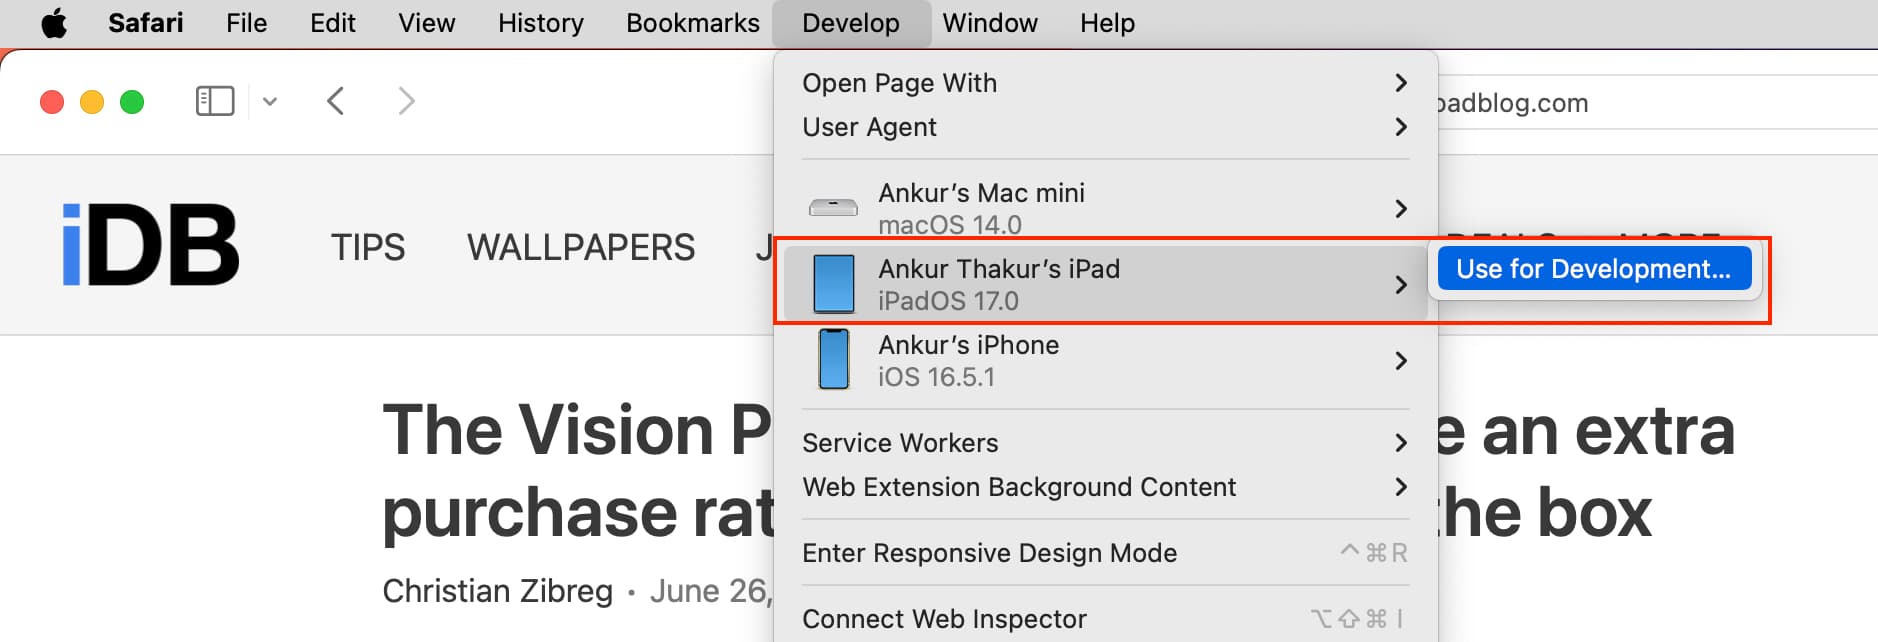
Note: If this is the first time you’re using your iPhone or iPad for this work, take your mouse cursor over that iPhone or iPad and click Use for Development. Next, tap Trust on your iPhone or iPad and enter the device passcode. Now, this iOS or iPadOS device is ready to be used for web inspection. If it still shows a correction error, simply unplug the USB cable and plug it in again.
Position the Safari Web Inspector
If you’re using the Web Inspector for iOS, it will remain in its own floating window.
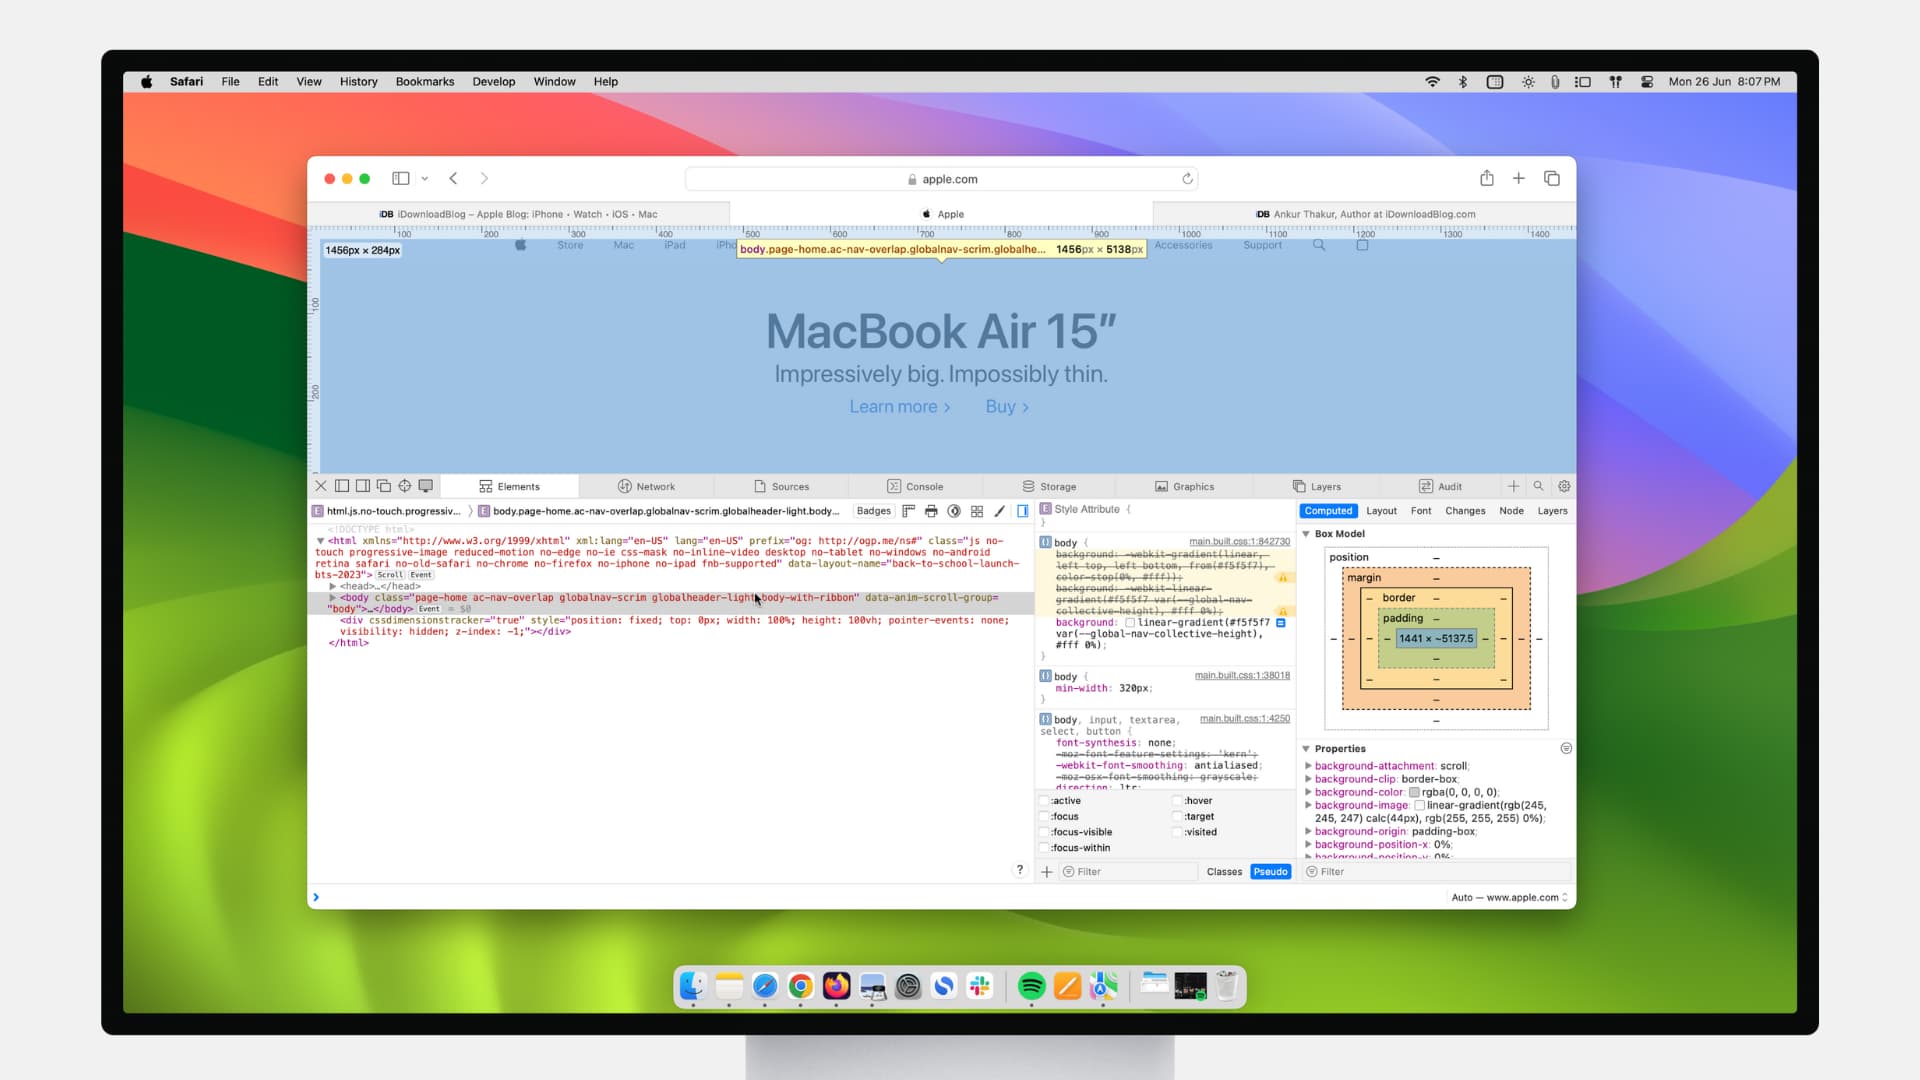
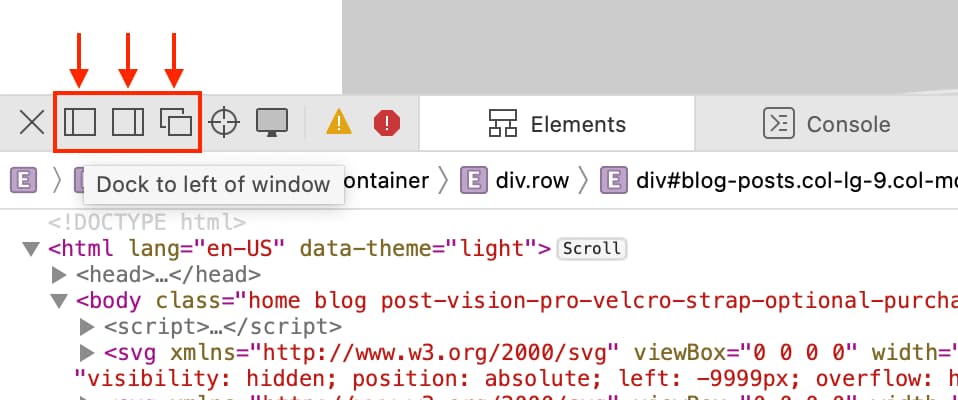
If you’re using it for Safari on your Mac, you can change its position. By default, Web Inspector displays at the bottom of your Safari window. To detach it and place it in a separate window or dock it to the left or right side of Safari, select one of the buttons from the top left of the Inspector window.
Get to know the Web Inspector
The Safari Web Inspector has a handy toolbar and tabs with some options that you can adjust to fit your needs.
Web Inspector toolbar
- “X” to close the Inspector
- Positioning buttons
- Reload button
- Download web archive button
- Activity viewer (resource count, resource size, load time, logs, errors, warnings)
- Element selector button
- Search box
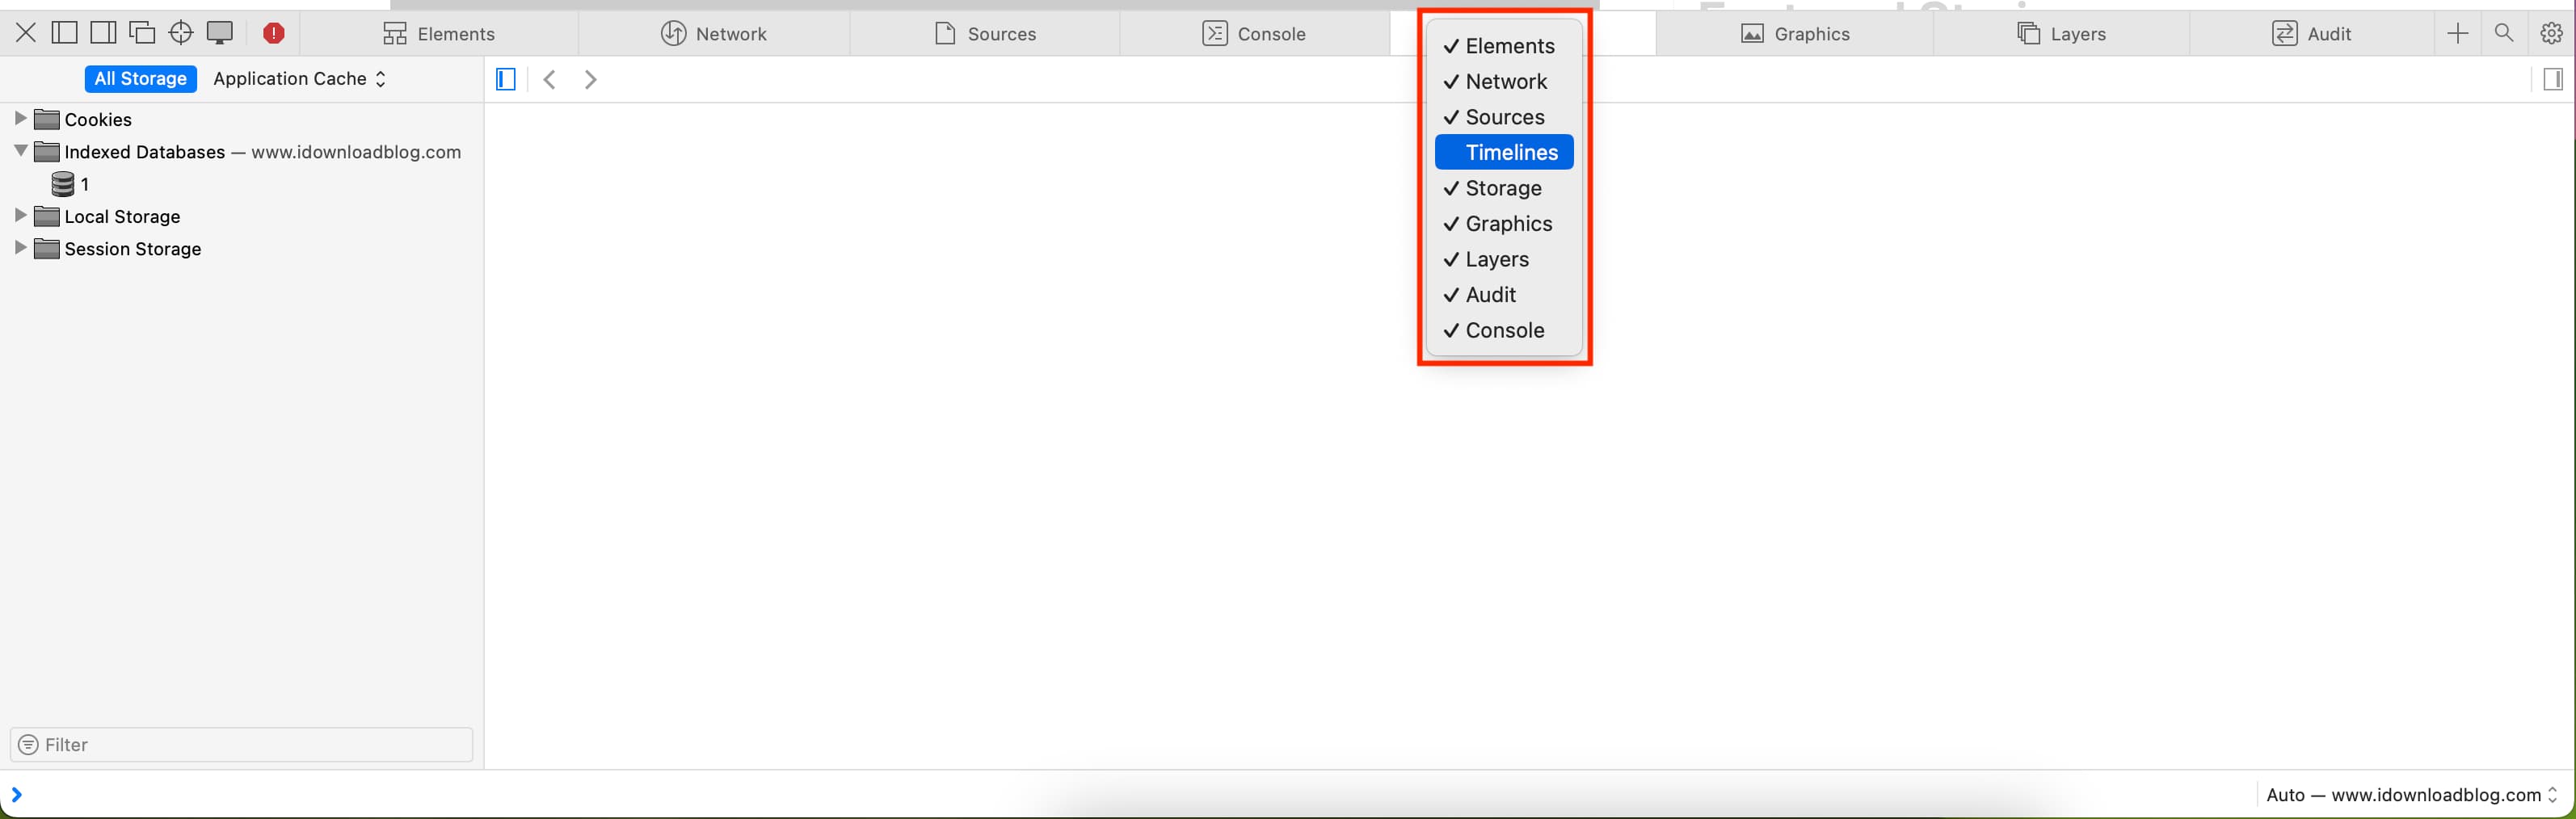
Web Inspector tabs
You can use all tabs or just a few. You can right-click or hold Control and click the tabs and then check and uncheck those you want to see. Rearrange the tabs by holding and dragging them to their new positions. And all the way to the right of the tabs bar, you’ll see a Settings button. This lets you adjust settings for tabs, indents, source maps, zoom, and more.
- Elements: Current state of the page’s Document Object Model
- Network: Resources loaded by the current page
- Debugger: View the JavaScript execution, variables, and control flow
- Resources: Resources being used by the current page’s content
- Timelines: A view of what the page’s content is doing
- Storage: State that is available to the page’s content
- Canvas: Contexts created from CSS
- Console: Shows logged messages and lets you evaluate JavaScript code
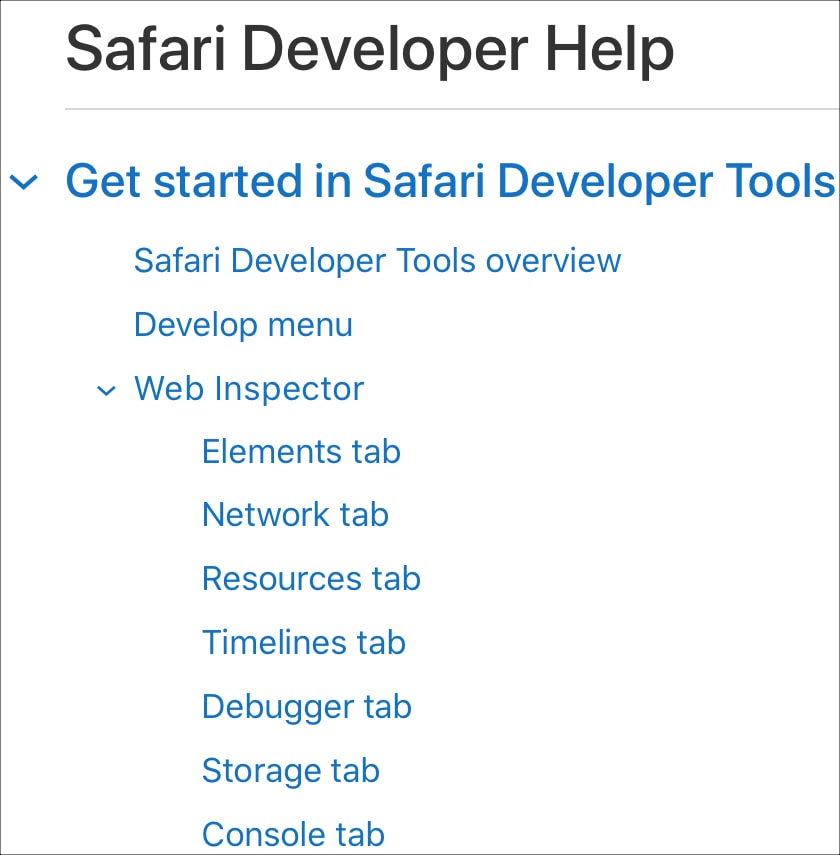
For in-depth help on a specific tab, you can head to the Apple Developer Support site. Select Table of Contents > Get started in Safari Developer Tools > Web Inspector.
Good luck with your inspection!
Hopefully, this guide will help you as you start working with the Safari Web Inspector for your iPhone, iPad, or Mac web development.
If you currently use the Web Inspector and have tips and tricks you’d like to share with others who are just starting, please feel free to comment below!
Check out next: How to view the source code of a webpage in Safari